Mexican Peso gains marginally after Mexico’s GDP data

Source Fxstreet
  • Mexican Peso notches minor gains with USD/MXN trading at 17.23, up 0.03%, as investors assess economic indicators from Mexico.
  • Mexican GDP growth falls short of expectations, influenced by Banxico's aggressive interest rate policy now at 11.25%.
  • In the US, Consumer Confidence improves and the robust labor market is highlighted by the latest JOLTs report, which could affect Federal Reserve policy.

The Mexican Peso holds minuscule gains versus the US Dollar in early trading during the North American session, sponsored by economic data from Mexico. In the US, the release of the JOLTs reports and Conference Board (CB) Consumer Confidence data could underpin the Greenback (USD), ahead of the US Federal Reserve (Fed) monetary policy decision on Wednesday. The USD/MXN exchanges hands at 17.19, down 0.13%.

Mexico’s economy grew below estimates, revealed the National Statistics Agency (INEGI). Higher interest rates set by the Bank of Mexico (Banxico) at 11.25% is having the desired effect on the economy as the latest GDP data trends lower alongside business activity. Across the border, CB Consumer Confidence improved in January, while the labor market remains hot, according to the JOLTs data.

Daily Digest Market Movers: Mexican Peso barely blinks after GDP figures, awaiting Fed decision

  • INEGI revealed that Mexican GDP for Q4 2023 expanded 0.1% QoQ, below forecasts of 0.4% and trailing the 1.1% expansion achieved in the third quarter. For annually based figures, GDP saw its preliminary reading rise by 2.4%, missing forecasts of 3.1% and down from 3.3% in Q3.
  • US Job Openings rebounded above the 9 million threshold, the highest level in three months and exceeding estimates of 8.75 million. The data emphasizes the strength of the labor market and might deter Fed officials from cutting rates sooner than expected.
  • Further, US data revealed that Consumer Confidence exceeded estimates of 114, coming at 114.8, up from December’s 108. “January's increase in consumer confidence likely reflected slower inflation, anticipation of lower interest rates ahead, and generally favorable employment conditions as companies continue to hoard labor,” said Dana Peterson, Chief Economist at The Conference Board.
  • Today’s data shows the Mexican economy remains strong. Coupled with inflation remaining above Banxico’s target, this could delay the first rate cut by Banxico, even though some officials commented that rate trimming could happen in the first quarter of 2024.
  • If Banxico’s officials remain determined to begin its easing cycle in Q1 of 2024, that could depreciate the emerging market currency due to the reduction of interest rate differentials. That could also underpin the USD/MXN pair toward the psychological 18.00 figure.
  • Additional factors that might depreciate the Mexican currency are geopolitical risks and risk aversion
  • Across the border, the US economy remains resilient, as GDP in Q4 of last year crushed forecasts despite easing from Q3’s 4.9%. That could force Fed officials to refrain from easing policy, but the latest inflation data suggests they’re close to getting inflation to its 2% target.
  • Nevertheless, mixed readings in other data suggest that risks have become more balanced. That is reflected by investors speculating that the Fed will cut rates by 139 basis points during 2024, according to the Chicago Board of Trade (CBOT) data.

Technical Analysis: Mexican Peso status firm as USD/MXN hovers near 17.20

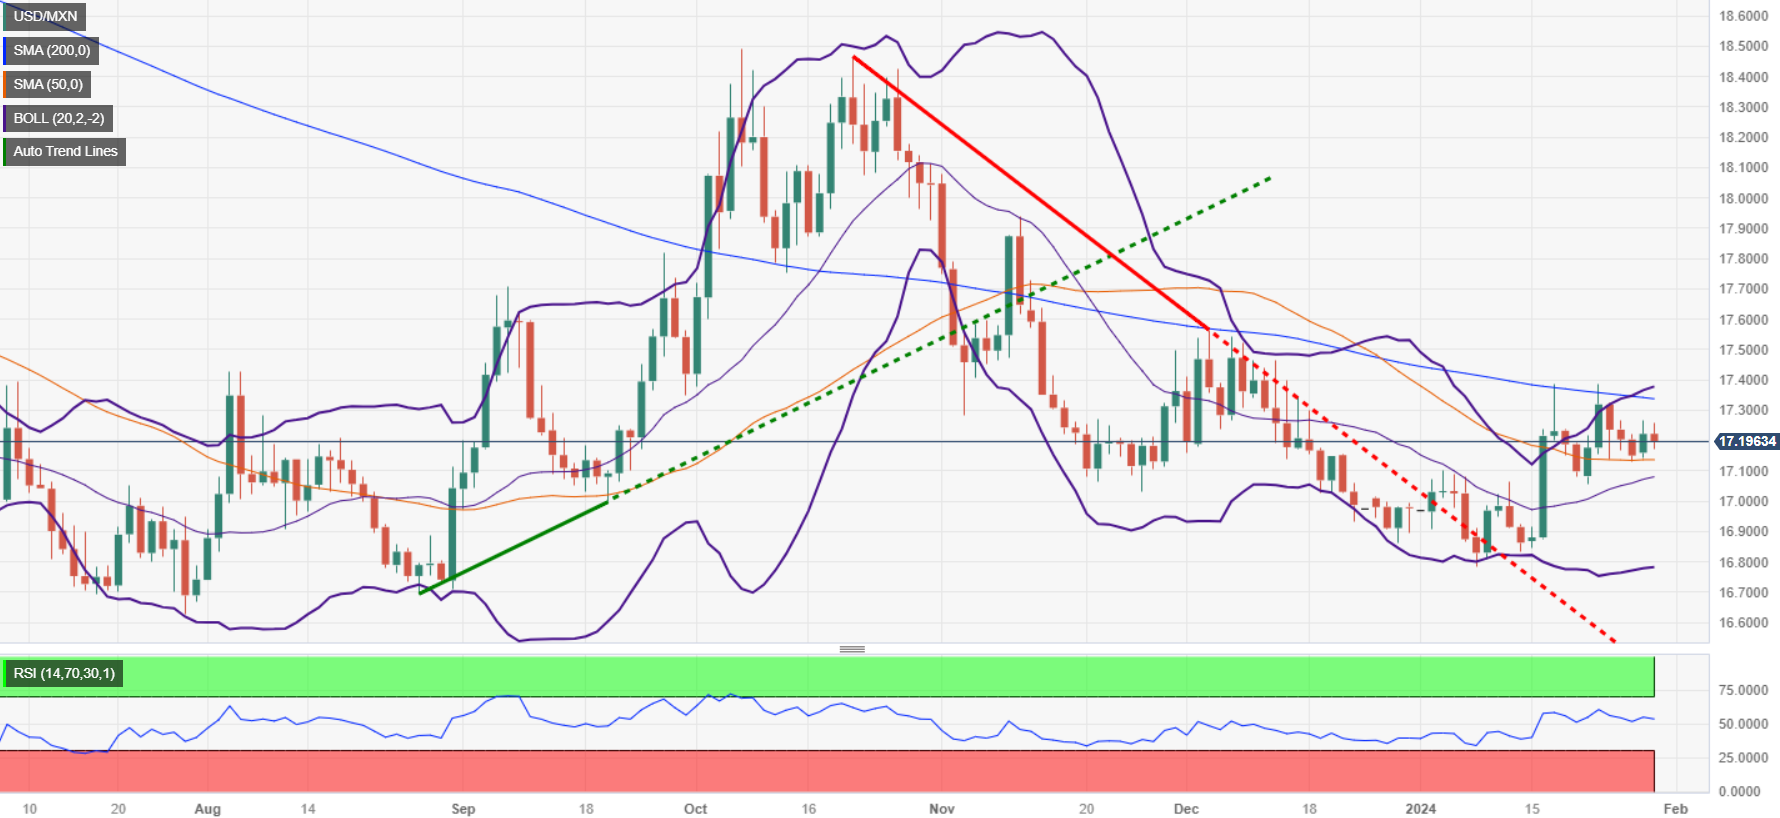
The USD/MXN trades sideways and is about to form an ascending triangle. The 200-day Simple Moving Average (SMA) at 17.34 is the first resistance level. If buyers conquer that level, the next stop would be the 100-day SMA at 17.41, followed by the December 9 high at 17.56. Last of all sits the May 23 high from last year at 17.99.

On the flipside, although a less likely scenario, the USD/MXN exchange rate could drop below the 50-day SMA at 17.13. A breach of the latter will expose the January 22 low at 17.05, followed by the 17.00 psychological level.

USD/MXN Price Action – Daily Chart

Mexican Peso FAQs

What key factors drive the Mexican Peso?

The Mexican Peso (MXN) is the most traded currency among its Latin American peers. Its value is broadly determined by the performance of the Mexican economy, the country’s central bank’s policy, the amount of foreign investment in the country and even the levels of remittances sent by Mexicans who live abroad, particularly in the United States. Geopolitical trends can also move MXN: for example, the process of nearshoring – or the decision by some firms to relocate manufacturing capacity and supply chains closer to their home countries – is also seen as a catalyst for the Mexican currency as the country is considered a key manufacturing hub in the American continent. Another catalyst for MXN is Oil prices as Mexico is a key exporter of the commodity.

How do decisions of the Banxico impact the Mexican Peso?

The main objective of Mexico’s central bank, also known as Banxico, is to maintain inflation at low and stable levels (at or close to its target of 3%, the midpoint in a tolerance band of between 2% and 4%). To this end, the bank sets an appropriate level of interest rates. When inflation is too high, Banxico will attempt to tame it by raising interest rates, making it more expensive for households and businesses to borrow money, thus cooling demand and the overall economy. Higher interest rates are generally positive for the Mexican Peso (MXN) as they lead to higher yields, making the country a more attractive place for investors. On the contrary, lower interest rates tend to weaken MXN.

How does economic data influence the value of the Mexican Peso?

Macroeconomic data releases are key to assess the state of the economy and can have an impact on the Mexican Peso (MXN) valuation. A strong Mexican economy, based on high economic growth, low unemployment and high confidence is good for MXN. Not only does it attract more foreign investment but it may encourage the Bank of Mexico (Banxico) to increase interest rates, particularly if this strength comes together with elevated inflation. However, if economic data is weak, MXN is likely to depreciate.

How does broader risk sentiment impact the Mexican Peso?

As an emerging-market currency, the Mexican Peso (MXN) tends to strive during risk-on periods, or when investors perceive that broader market risks are low and thus are eager to engage with investments that carry a higher risk. Conversely, MXN tends to weaken at times of market turbulence or economic uncertainty as investors tend to sell higher-risk assets and flee to the more-stable safe havens.

Disclaimer: For information purposes only. Past performance is not indicative of future results.
placeholder
Gold Price Forecast: XAU/USD drifts higher above $4,200 as Fed delivers expected cutGold price (XAU/USD) gains momentum to around $4,235 during the early Asian session on Thursday. The precious metal extends its upside after the US Federal Reserve (Fed) delivered an expected third consecutive interest rate cut and maintained its outlook for just one cut in 2026.
Author  FXStreet
Dec 11, Thu
Gold price (XAU/USD) gains momentum to around $4,235 during the early Asian session on Thursday. The precious metal extends its upside after the US Federal Reserve (Fed) delivered an expected third consecutive interest rate cut and maintained its outlook for just one cut in 2026.
placeholder
Ethereum Price Slips Lower — $3,000 Looms as the Key BattlegroundEthereum is attempting to recover from a $3,026 low but remains below $3,200 and the 100-hour SMA, with a bearish trend line near $3,175 capping rebounds as bulls need a clean break above $3,200 to target $3,250–$3,400, while a drop below $3,050 risks a retest of $3,000 and $2,940.
Author  Mitrade
Dec 15, Mon
Ethereum is attempting to recover from a $3,026 low but remains below $3,200 and the 100-hour SMA, with a bearish trend line near $3,175 capping rebounds as bulls need a clean break above $3,200 to target $3,250–$3,400, while a drop below $3,050 risks a retest of $3,000 and $2,940.
placeholder
Bitcoin Slides 5% as Sellers Lean In — Can BTC Reclaim $88,000?Bitcoin has dropped back below $88,000 after rolling over from $90,500, with price still trading under the 100-hour Simple Moving Average. The sell-off found a floor at $85,151, and BTC is now consolidating near that base, but rebounds are facing pressure from a bearish trend line around $89,000. Bulls need to retake $88,000–$89,000 to ease downside risk; failure to do so keeps $85,500–$85,000 and then $83,500 in play, with $80,000 as the deeper “line in the sand.” Bitcoin (BTC) is back in damage-control mode after a sharp pullback wiped out recent gains. The price failed to reclaim the $90,000–$90,500 band, rolled over, and slid through $88,500 before briefly dipping under $87,000. Buyers did show up around $85,000, but the rebound so far looks more like stabilization than a clear trend reversal. Bitcoin dips hard, finds a bid near $85,000(h3) BTC’s latest move lower began when it couldn’t build follow-through above $90,000 and $90,500. Once that upside stalled, sellers took control and pushed price down through $88,500. The slide accelerated enough to spike below $87,000, but the market didn’t free-fall. Bulls defended the $85,000 zone, printing a low at $85,151. Since then, Bitcoin has been consolidating below the 23.6% Fibonacci retracement of the drop from the $93,560 swing high to the $85,151 low — a clue that the bounce is still shallow and that sellers haven’t fully backed off yet. Structurally, BTC is still on the back foot: It’s trading below $88,000, and It remains below the 100-hour Simple Moving Average, keeping short-term trend pressure pointed downward. Resistance is layered, and $89,000 is the problem area(h3) If bulls try to turn this into a recovery, they’ll have to climb through multiple ceilings in quick succession. First, BTC faces resistance around $87,150, followed by a more meaningful barrier near $87,500. From there, the market’s attention snaps back to $88,000 — the level BTC just lost and now needs to reclaim. A close back above $88,000 would improve the tone, but it doesn’t solve the bigger issue: there’s a bearish trend line on the hourly BTC/USD chart (Kraken feed) with resistance near $89,000, which also lines up with the next technical hurdle. If BTC can push through $89,000 and hold, the rebound could extend toward $90,000, with follow-through targets at $91,000 and $91,500. But until price clears that $88,000–$89,000 zone, rallies are at risk of being sold rather than chased. If BTC fails to reclaim resistance, the downside path is clear(h3) The near-term bear case is simple: if Bitcoin can’t climb back above the $87,000 area and keep traction, sellers may attempt another leg lower. Support levels line up like this: Immediate support: $85,500 First major support: $85,000 Next support: $83,500 Then $82,500 in the near term Below that, the major “don’t break this” level is still $80,000. If BTC slips under $80,000, the risk of acceleration to the downside increases significantly — not because it’s magic, but because it’s the kind of psychological and structural level that tends to trigger forced de-risking. Indicators: momentum still leans bearish(h3) The intraday indicators aren’t offering much comfort yet: Hourly MACD is losing pace in the bearish zone. Hourly RSI remains below 50, suggesting sellers still have the upper hand on short timeframes. So while the $85,000 defense held for now, the market hasn’t flipped bullish — it’s just stopped bleeding.
Author  Mitrade
Dec 16, Tue
Bitcoin has dropped back below $88,000 after rolling over from $90,500, with price still trading under the 100-hour Simple Moving Average. The sell-off found a floor at $85,151, and BTC is now consolidating near that base, but rebounds are facing pressure from a bearish trend line around $89,000. Bulls need to retake $88,000–$89,000 to ease downside risk; failure to do so keeps $85,500–$85,000 and then $83,500 in play, with $80,000 as the deeper “line in the sand.” Bitcoin (BTC) is back in damage-control mode after a sharp pullback wiped out recent gains. The price failed to reclaim the $90,000–$90,500 band, rolled over, and slid through $88,500 before briefly dipping under $87,000. Buyers did show up around $85,000, but the rebound so far looks more like stabilization than a clear trend reversal. Bitcoin dips hard, finds a bid near $85,000(h3) BTC’s latest move lower began when it couldn’t build follow-through above $90,000 and $90,500. Once that upside stalled, sellers took control and pushed price down through $88,500. The slide accelerated enough to spike below $87,000, but the market didn’t free-fall. Bulls defended the $85,000 zone, printing a low at $85,151. Since then, Bitcoin has been consolidating below the 23.6% Fibonacci retracement of the drop from the $93,560 swing high to the $85,151 low — a clue that the bounce is still shallow and that sellers haven’t fully backed off yet. Structurally, BTC is still on the back foot: It’s trading below $88,000, and It remains below the 100-hour Simple Moving Average, keeping short-term trend pressure pointed downward. Resistance is layered, and $89,000 is the problem area(h3) If bulls try to turn this into a recovery, they’ll have to climb through multiple ceilings in quick succession. First, BTC faces resistance around $87,150, followed by a more meaningful barrier near $87,500. From there, the market’s attention snaps back to $88,000 — the level BTC just lost and now needs to reclaim. A close back above $88,000 would improve the tone, but it doesn’t solve the bigger issue: there’s a bearish trend line on the hourly BTC/USD chart (Kraken feed) with resistance near $89,000, which also lines up with the next technical hurdle. If BTC can push through $89,000 and hold, the rebound could extend toward $90,000, with follow-through targets at $91,000 and $91,500. But until price clears that $88,000–$89,000 zone, rallies are at risk of being sold rather than chased. If BTC fails to reclaim resistance, the downside path is clear(h3) The near-term bear case is simple: if Bitcoin can’t climb back above the $87,000 area and keep traction, sellers may attempt another leg lower. Support levels line up like this: Immediate support: $85,500 First major support: $85,000 Next support: $83,500 Then $82,500 in the near term Below that, the major “don’t break this” level is still $80,000. If BTC slips under $80,000, the risk of acceleration to the downside increases significantly — not because it’s magic, but because it’s the kind of psychological and structural level that tends to trigger forced de-risking. Indicators: momentum still leans bearish(h3) The intraday indicators aren’t offering much comfort yet: Hourly MACD is losing pace in the bearish zone. Hourly RSI remains below 50, suggesting sellers still have the upper hand on short timeframes. So while the $85,000 defense held for now, the market hasn’t flipped bullish — it’s just stopped bleeding.
placeholder
December Santa Claus Rally: New highs in sight for US and European stocks?Historical data show a rising trend of US and European stocks in December. If the momentum is strong, fund managers may rush in with a buying frenzy.
Author  Mitrade
Yesterday 02: 50
Historical data show a rising trend of US and European stocks in December. If the momentum is strong, fund managers may rush in with a buying frenzy.
placeholder
XRP’s Price Action Flashes a Warning Even as ETF Flows Stay PositiveXRP’s structure remains weak despite 18 straight positive closes in spot XRP ETFs, with analysts warning that $1.98 and other nearby resistance zones could cap rebounds unless the YO region is reclaimed, while deeper downside scenarios keep $1.53 on watch as a potential (not guaranteed) accumulation area.
Author  Mitrade
21 hours ago
XRP’s structure remains weak despite 18 straight positive closes in spot XRP ETFs, with analysts warning that $1.98 and other nearby resistance zones could cap rebounds unless the YO region is reclaimed, while deeper downside scenarios keep $1.53 on watch as a potential (not guaranteed) accumulation area.
goTop
quote