EUR/GBP Price Analysis: Mixed outlook as bulls and bears tussle near 0.8380

Source Fxstreet
  • Overall, the EUR/GBP consolidates sideways with no clear trend.
  • RSI suggests rising selling pressure, while MACD indicates declining buying pressure in the short term.
  • Bulls failed to defend the 20-day SMA which wornsed the outlook

The EUR/GBP pair trades around 0.8380, consolidating sideways and displaying no clear trend. In addition, the cross lost the 20-day Simple Moving Average (SMA) which might a downwards leg.

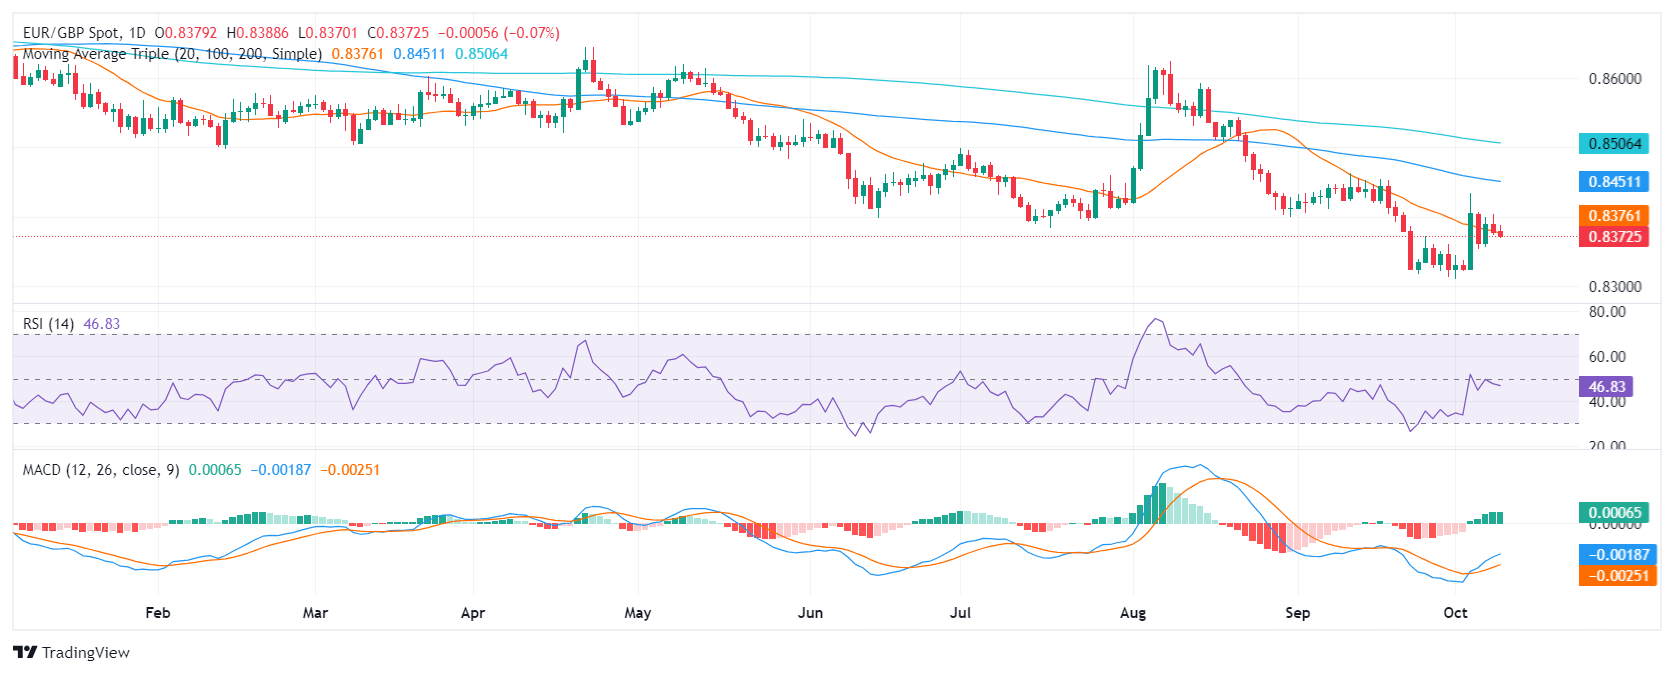
The technical indicators present that the bulls are backing off. The Relative Strength Index (RSI) is at 46 in negative territory and declining, indicating rising selling pressure. The Moving Average Convergence Divergence (MACD) presents a decreasing green histogram, suggesting declining buying pressure.

Bullish pressure can prevail if the price can break through the resistance level of 0.8400 and firmly hold above the 20-day Simple Moving Average (SMA). If that happens, the EUR/GBP pair could rise to 0.8450 or even 0.8500. On the other hand, a decline below the support level of 0.8320 could lead to further declines below 0.8300.

EUR/GBP daily chart

Disclaimer: For information purposes only. Past performance is not indicative of future results.
placeholder
Finding The Best Japan Stocks to Buy? These are Top Japanese Companies to Watch Discover the best Japanese stocks to buy, including AI semiconductor leaders, Buffett-backed trading houses, and undervalued Japan stocks benefiting from corporate reforms and yen trends.
Author  Mitrade
May 29, Fri
Discover the best Japanese stocks to buy, including AI semiconductor leaders, Buffett-backed trading houses, and undervalued Japan stocks benefiting from corporate reforms and yen trends.
placeholder
Bitcoin loses $73,000 as US-Iran escalation, ETF outflows deepen crypto market sell-offThe broader cryptocurrency market is down $2.45 trillion on Thursday, from $2.54 trillion the previous day, led by Bitcoin’s (BTC) decline below $73,000.
Author  FXStreet
May 28, Thu
The broader cryptocurrency market is down $2.45 trillion on Thursday, from $2.54 trillion the previous day, led by Bitcoin’s (BTC) decline below $73,000.
placeholder
Bitcoin Price Forecast: BTC risks losing $70,000 as AI and chip rally steal the spotlightBitcoin (BTC) edges below $73,000 at press time on Monday, extending its decline under the prevailing downside pressure from three consecutive weeks of losses.
Author  FXStreet
Jun 01, Mon
Bitcoin (BTC) edges below $73,000 at press time on Monday, extending its decline under the prevailing downside pressure from three consecutive weeks of losses.
placeholder
Gold declines below $4,500 as Iran tensions stoke inflation fears and bolster Fed hike betsGold price (XAU/USD) declines to around $4,485 during the early Asian session on Tuesday. The precious metal loses ground as renewed tensions in the Middle East continue to fuel concerns over inflation and expectations of elevated interest rates.
Author  FXStreet
Yesterday 01: 18
Gold price (XAU/USD) declines to around $4,485 during the early Asian session on Tuesday. The precious metal loses ground as renewed tensions in the Middle East continue to fuel concerns over inflation and expectations of elevated interest rates.
placeholder
WTI rises to near $93.00 as Iran launches missiles toward Kuwait, BahrainWest Texas Intermediate (WTI) gains ground for the third successive day, trading around $92.90 per barrel during the Asian hours on Wednesday.
Author  FXStreet
13 hours ago
West Texas Intermediate (WTI) gains ground for the third successive day, trading around $92.90 per barrel during the Asian hours on Wednesday.
Related Instrument
goTop
quote