NZD/JPY Price Analysis: Consolidation remains, slight upward bias

Source Fxstreet
  • NZD/JPY is trading within a range, bounded by 90.10 and 91.60.
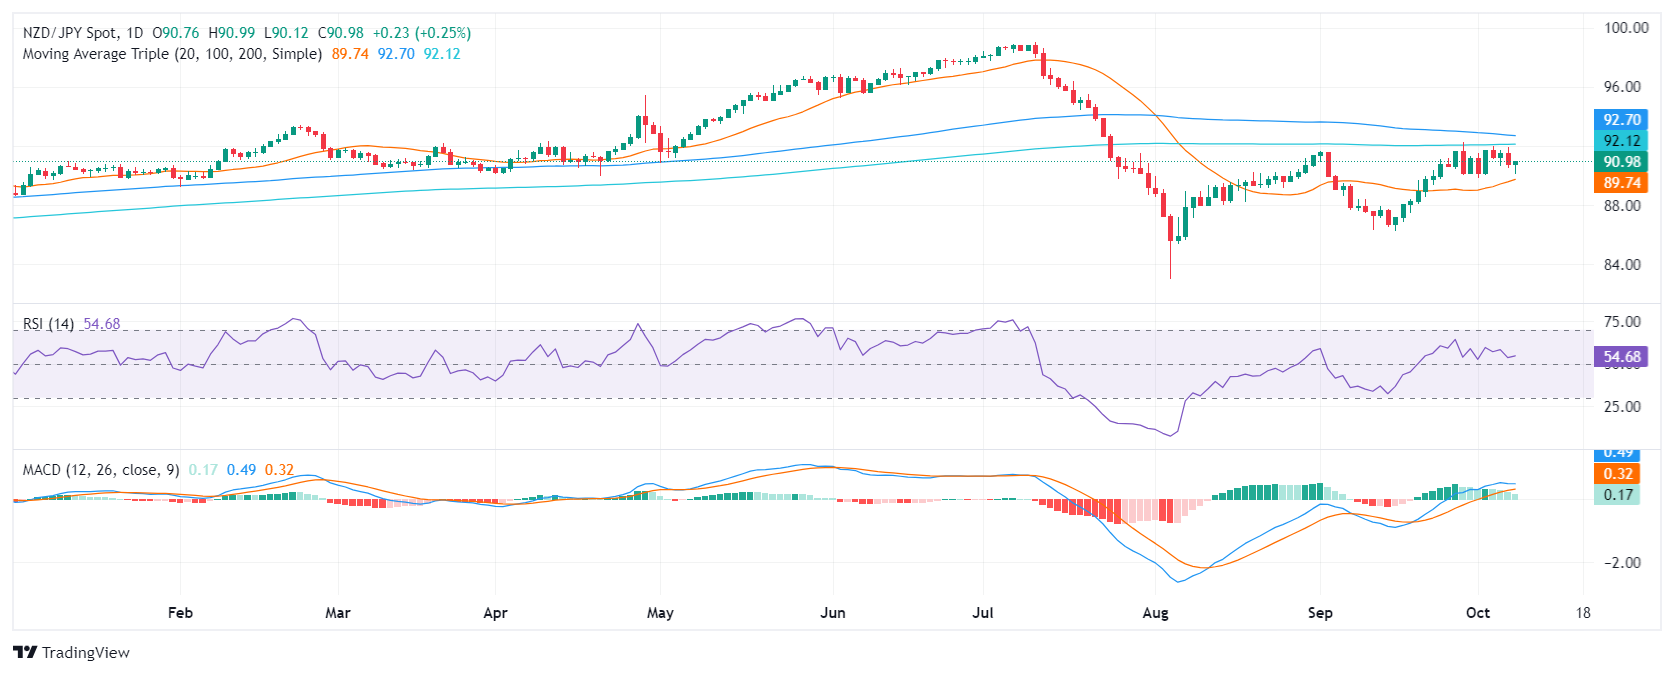
  • RSI is slightly rising in positive territory, MACD declining but still positive.
  • A clear direction is lacking, but a potential upside breakout could take place.

The NZD/JPY pair continues moving sideways on Wednesday, extending the consolidation of the past week. The pair is currently trading at 91.00, with 0.30% gains and a slight upward bias. The pair remains trapped within the range defined by the 90.00 support and the 91.00 resistance, with indicators showing a lack of clear direction.

The technical indicators provide a mixed picture. The Relative Strength Index (RSI) is at 55, in the positive terrain, and has a slightly rising slope, indicating that buying pressure is steady. However, the Moving Average Convergence Divergence (MACD) is green and decreasing, suggesting that buying pressure is weak.

The overall outlook is slightly bullish due to the pair's position above the 20-day Simple Moving Averages (SMA). However, caution is advised as the MACD shows signs of weakening which could lead to a bearish leg. The main support level is the 90.00 area (20-day SMA) which in case of being lost could ignite a drop to the 88.00-87.00 range. On the other hand, the main resistance to conquer is the 91.00 area which could fuel a rise towards 91.60.

NZD/JPY daily chart


Disclaimer: For information purposes only. Past performance is not indicative of future results.
placeholder
$180 Oil Prices Imminent? Saudi Arabia Warns: Crisis to Last Until Late April, Oil Prices Will Break Historic HighsThe continuous escalation of geopolitical conflicts in the Middle East is pushing global energy markets toward their most severe test in nearly 20 years.The Wall Street Journal reports th
Author  TradingKey
Yesterday 10: 11
The continuous escalation of geopolitical conflicts in the Middle East is pushing global energy markets toward their most severe test in nearly 20 years.The Wall Street Journal reports th
placeholder
Gold tumbles below $4,650 as inflation fears and liquidity squeeze weighGold price (XAU/USD) remains under selling pressure near $4,640 during the early Asian session on Friday. The precious metal extends the decline as soaring crude oil and energy prices, driven by the escalating US-Israeli war with Iran, reignite inflation fears.
Author  FXStreet
Yesterday 01: 22
Gold price (XAU/USD) remains under selling pressure near $4,640 during the early Asian session on Friday. The precious metal extends the decline as soaring crude oil and energy prices, driven by the escalating US-Israeli war with Iran, reignite inflation fears.
placeholder
Bitcoin Drops Below $70,000 as Crypto Rally Fails to MaterializeThe crypto market experienced a significant pullback, Bitcoin (BTCUSD) fell below the key $70,000 mark during intraday trading, triggering short-term stop-loss orders and causing market s
Author  TradingKey
Mar 19, Thu
The crypto market experienced a significant pullback, Bitcoin (BTCUSD) fell below the key $70,000 mark during intraday trading, triggering short-term stop-loss orders and causing market s
placeholder
Gold falls below $4,850 as Fed holds rates steadyGold price (XAU/USD) faces some selling pressure near $4,830 during the early Asian session on Thursday.
Author  FXStreet
Mar 19, Thu
Gold price (XAU/USD) faces some selling pressure near $4,830 during the early Asian session on Thursday.
placeholder
WTI Crude Prices Capped at $100, Has the Rally Ended? How to Trade the Short Term? Today (March 18), WTI crude oil continued to exhibit significant short-term volatility, driven by a tug-of-war between headlines and data. Intraday, prices retreated from Tuesday's high o
Author  TradingKey
Mar 18, Wed
Today (March 18), WTI crude oil continued to exhibit significant short-term volatility, driven by a tug-of-war between headlines and data. Intraday, prices retreated from Tuesday's high o
Related Instrument
goTop
quote