NZD/USD Price Analysis: Bears take the reins, technical outlook signals further losses

Source Fxstreet
  • The NZD/USD declined by 0.60% to 0.6125, extending its recent downtrend.
  • The RSI is in negative territory and declining, while the MACD histogram is red and rising.
  • A break below 0.6100 could open the door for a further decline towards 0.6000.

In Monday's session, the NZD/USD pair extended its recent decline, falling by 0.60% to 0.6125. The pair has been in a downtrend lately, and today's losses extend that trend. The technical indicators are also bearish, suggesting that the selling pressure is likely to continue.

The Relative Strength Index (RSI) is currently at 40, which is in negative territory and declining sharply. This suggests that selling pressure is increasing and that the bears are in control of the market. The Moving Average Convergence Divergence (MACD) histogram is also red and rising, indicating a bearish outlook. As long as the RSI remains below 50 and the MACD histogram remains red, the technical outlook will remain bearish for the NZD/USD.

NZD/USD daily chart

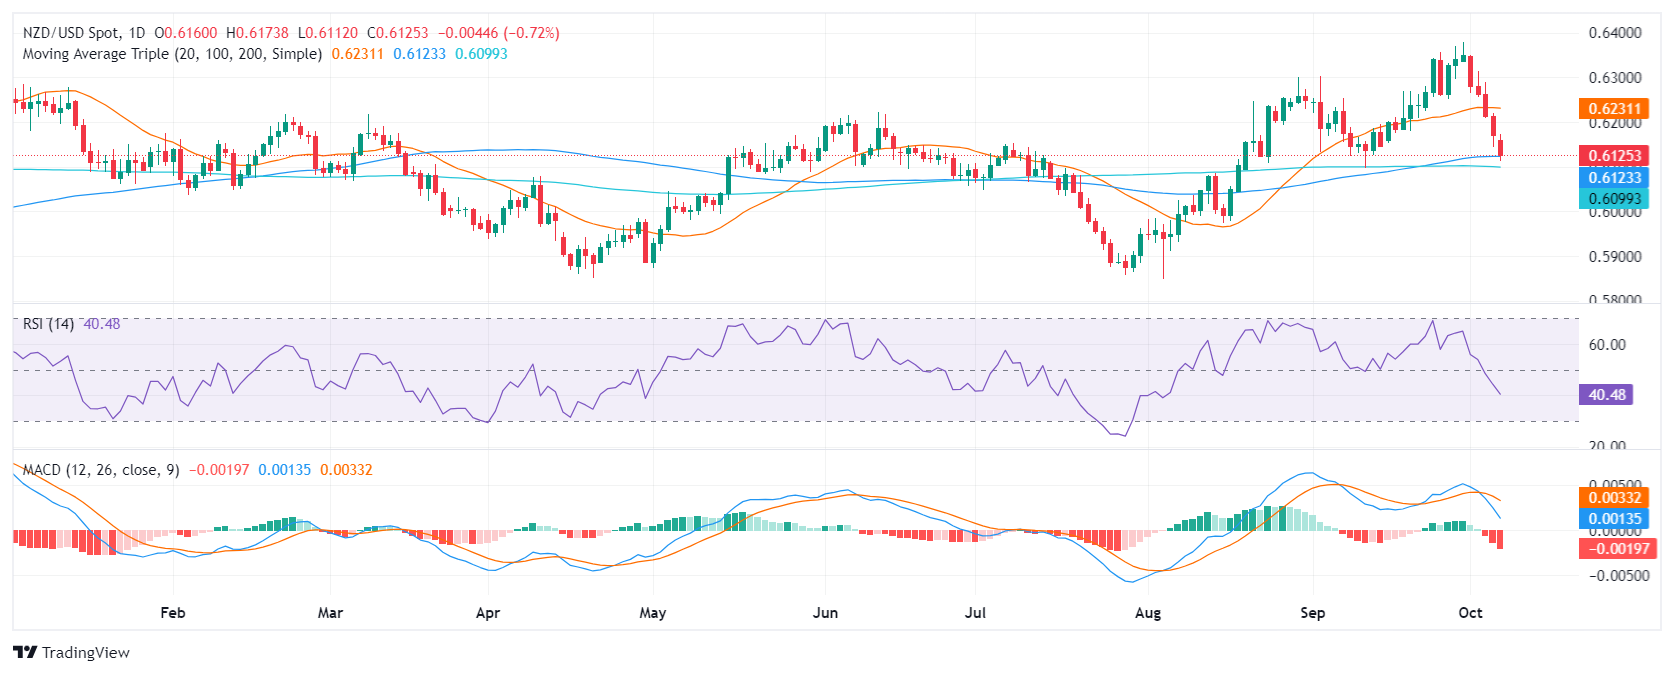
The overall outlook for the NZD/USD is bearish as the pair lost its 20-day Simple Moving Average (SMA). On the bright side, the sellers encountered a barrier at the 100-day SMA at 0.6120 which can mitigate the losses in the near term. That being said, a break below this level could open the door for a further decline towards 0.6000.


Disclaimer: For information purposes only. Past performance is not indicative of future results.
placeholder
Bitcoin CME gaps at $35,000, $27,000 and $21,000, which one gets filled first?Prioritize filling the $27,000 gap and even try higher.
Author  FXStreet
Aug 22, 2023
Prioritize filling the $27,000 gap and even try higher.
placeholder
Natural Gas sinks to pivotal level as China’s demand slumpsNatural Gas price (XNG/USD) edges lower and sinks to $2.56 on Monday, extending its losing streak for the fifth day in a row. The move comes on the back of China cutting its Liquified Natural Gas (LNG) imports after prices rose above $3.0 in June. It
Author  FXStreet
Jul 01, 2024
Natural Gas price (XNG/USD) edges lower and sinks to $2.56 on Monday, extending its losing streak for the fifth day in a row. The move comes on the back of China cutting its Liquified Natural Gas (LNG) imports after prices rose above $3.0 in June. It
placeholder
Silver Price Forecast: XAG/USD plummets below $76 as oil price posts fresh weekly highSilver price (XAG/USD) is down almost 2.3% to near $76.00 during the European trading session on Thursday. The white metal faces selling pressure as oil prices extends its winning streak for the third trading day on Thursday.
Author  FXStreet
Apr 23, Thu
Silver price (XAG/USD) is down almost 2.3% to near $76.00 during the European trading session on Thursday. The white metal faces selling pressure as oil prices extends its winning streak for the third trading day on Thursday.
placeholder
Gold drops below $4,700 on stronger US Dollar, Middle East tensions Gold price (XAU/USD) falls to around $4,690 during the early Asian session on Friday. The precious metal attracts some sellers amid a stronger US Dollar (USD) and elevated oil prices that stoked inflation worries. 
Author  FXStreet
Apr 24, Fri
Gold price (XAU/USD) falls to around $4,690 during the early Asian session on Friday. The precious metal attracts some sellers amid a stronger US Dollar (USD) and elevated oil prices that stoked inflation worries. 
placeholder
WTI sticks to modest gains above $94.00 as Hormuz standoff fuels supply concernsWest Texas Intermediate (WTI) – the benchmark US Crude Oil price – kicks off the new week on a positive note and reverses a part of Friday's modest decline, though the upside remains capped.
Author  FXStreet
12 hours ago
West Texas Intermediate (WTI) – the benchmark US Crude Oil price – kicks off the new week on a positive note and reverses a part of Friday's modest decline, though the upside remains capped.
Related Instrument
goTop
quote