


USD/INR softens ahead of Indian PMI, US NFP data
- Indian Rupee holds positive ground in Friday’s Asian session.
- Higher crude oil prices and Foreign Portfolio Investors (FPI) outflows weigh on the INR.
- Investors await the HSBC India Services PMI and US employment data.
The Indian Rupee (INR) recovers some lost ground on Friday. The rise in crude oil prices amid escalating geopolitical tensions in the Middle East, the significant outflow from domestic equities and regional currency downtrends could undermine the INR.
Investors will closely monitor the HSBC India Services Purchasing Managers Index (PMI) on Friday, which is expected to decline to 58.9 in September from 60.9 in August. On the US docket, the employment data for September will take center stage, including Nonfarm Payrolls (NFP) and Unemployment Rate. The US economy is expected to see 140K jobs added in September. While the Unemployment Rate is expected to remain unchanged at 4.2% in the same period. If the report shows a weaker-than-expected outcome, this could weigh on the Greenback.
Daily Digest Market Movers: Indian Rupee trades firmer, potential upside seems limited
- According to the World Bank’s latest report, the Indian economy continues to grow at a healthy pace despite global challenges, but to reach its $1 trillion merchandise exports goal by 2030, India needs to diversify its export basket and leverage global value chains.
- The US Services PMI climbed to 54.9 in September from 51.5 in August, the Institute for Supply Management (ISM) showed on Thursday. This figure came in stronger than the market forecast of 51.7.
- The US weekly Initial Jobless Claims in the US rose by 6,000 to 225,000 in the week ending September 28. This figure followed the previous week's print of 219,000 (revised from 218,000) and was worse than the market expectation of 220,000.
- Federal Reserve Bank of Chicago President Austan Goolsbee reiterated on Thursday that the interest rates need to come down over the next year by “a lot.” Goolsbee further stated that he’d like to keep the unemployment rate at 4.2% and prevent it from rising any further.
- The markets have priced in nearly 68.9% odds of a 25 bps Fed rate cut, while the chance of 50 bps reductions stands at 31.1%, according to the CME FedWatch Tool.
Technical Analysis: USD/INR keeps the positive bias in the longer term
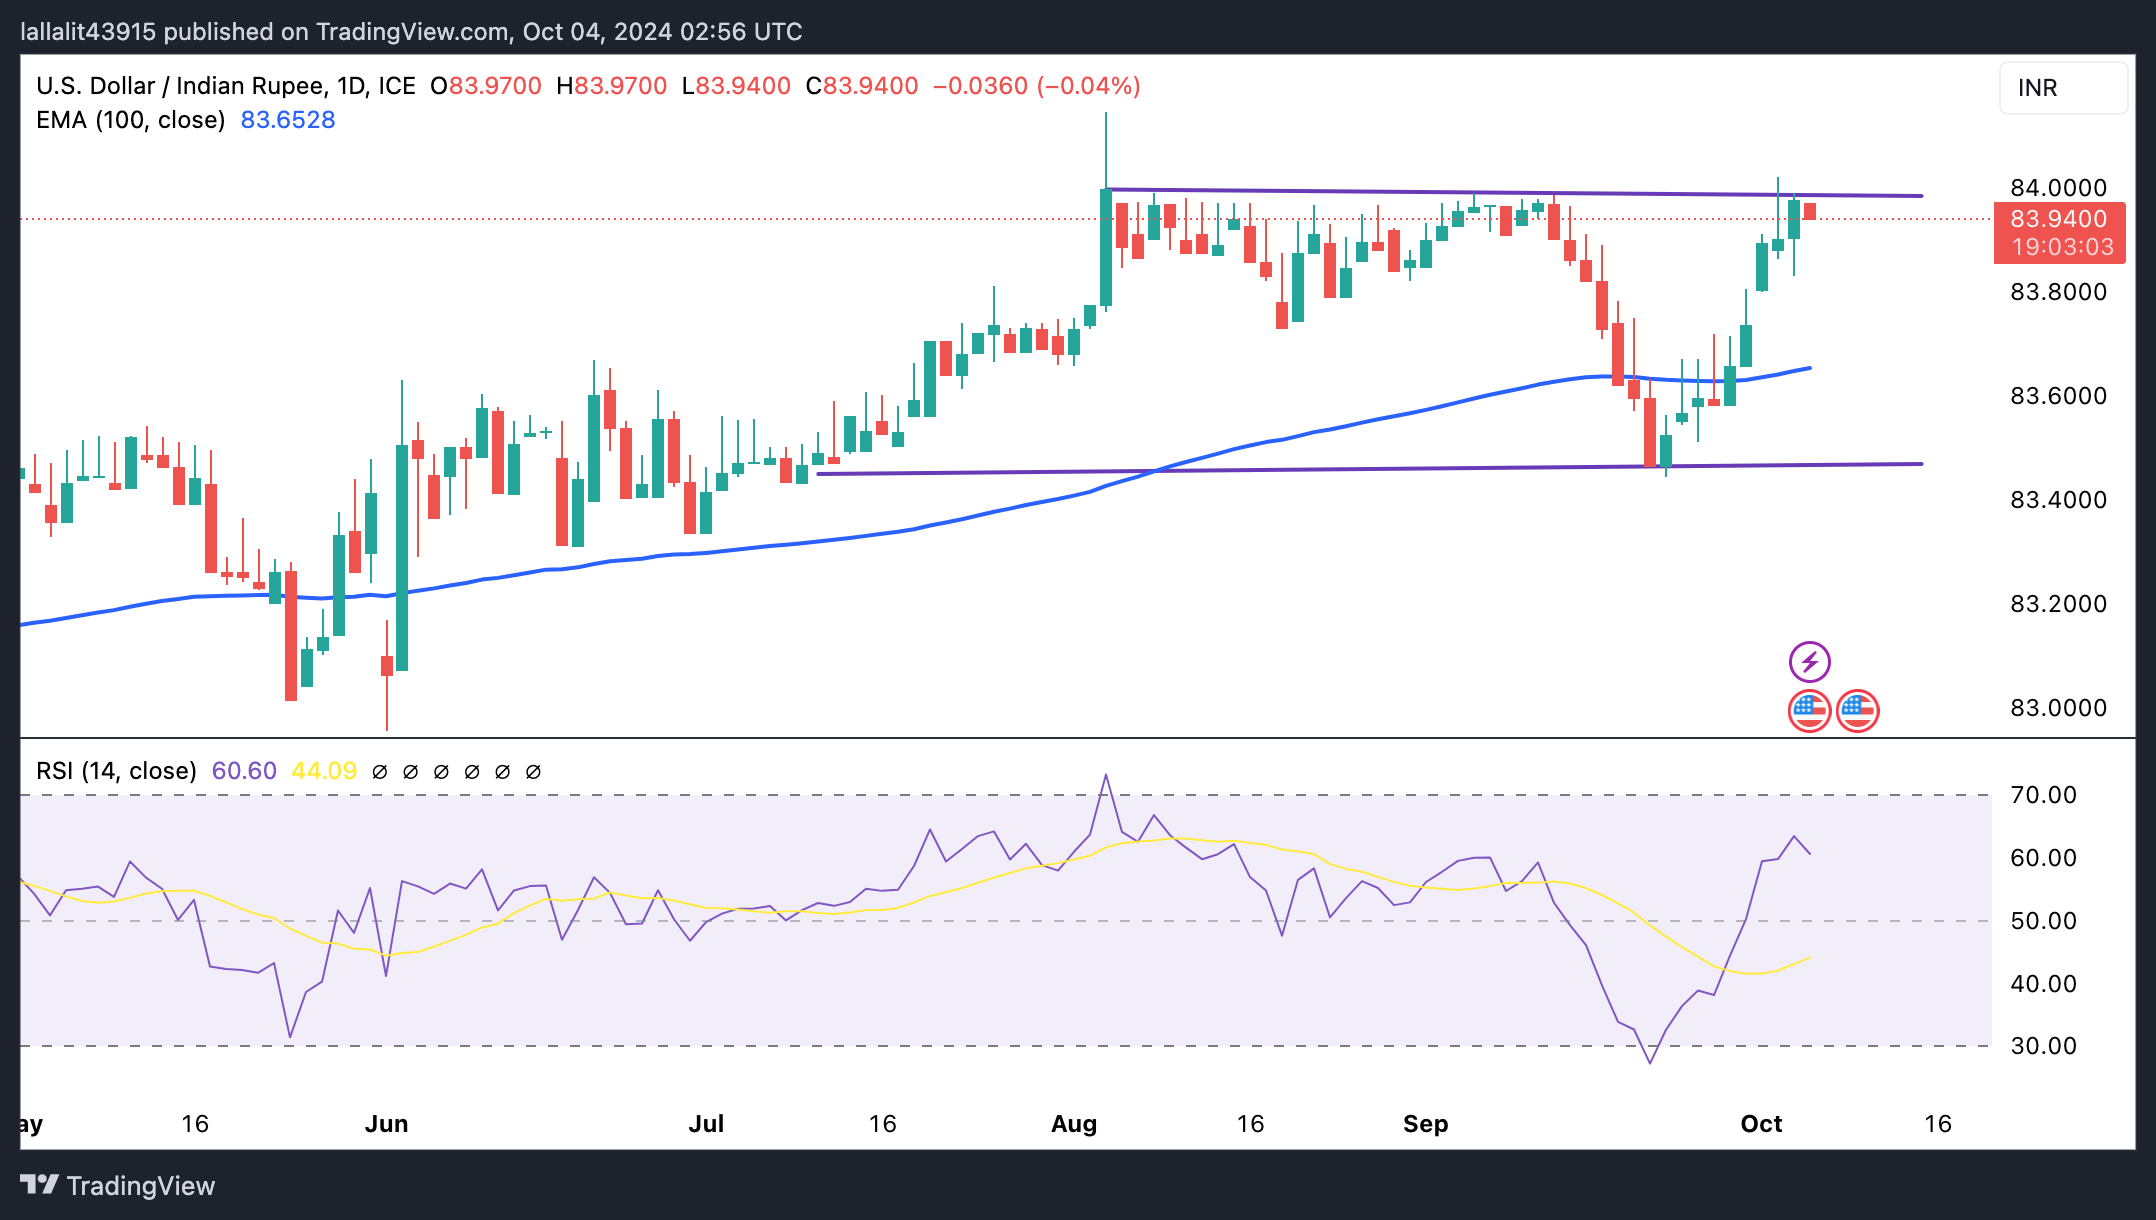
The Indian Rupee trades stronger on the day. The USD/INR pair maintains its constructive outlook on the daily chart as the price is well-supported above the key 100-day Exponential Moving Average (EMA). The path of least resistance level is to the upside as the 14-day Relative Strength Index (RSI) stands above the midline near 61.0.
The key upside barrier for USD/INR emerges at the 84.00 level, representing the upper boundary of the rectangle and psychological mark. A decisive break above this level could attract some buyers to 84.15 (the high of August 5), followed by 84.50.
On the downside, the low of October 1 at 83.80 acts as an initial support level for the pair. A breach of this level could lead to the 100-day EMA at 83.65. Further south, the additional downside filter to watch is 83.00, representing the round mark and the low of May 24.
Indian Rupee FAQs
The Indian Rupee (INR) is one of the most sensitive currencies to external factors. The price of Crude Oil (the country is highly dependent on imported Oil), the value of the US Dollar – most trade is conducted in USD – and the level of foreign investment, are all influential. Direct intervention by the Reserve Bank of India (RBI) in FX markets to keep the exchange rate stable, as well as the level of interest rates set by the RBI, are further major influencing factors on the Rupee.
The Reserve Bank of India (RBI) actively intervenes in forex markets to maintain a stable exchange rate, to help facilitate trade. In addition, the RBI tries to maintain the inflation rate at its 4% target by adjusting interest rates. Higher interest rates usually strengthen the Rupee. This is due to the role of the ‘carry trade’ in which investors borrow in countries with lower interest rates so as to place their money in countries’ offering relatively higher interest rates and profit from the difference.
Macroeconomic factors that influence the value of the Rupee include inflation, interest rates, the economic growth rate (GDP), the balance of trade, and inflows from foreign investment. A higher growth rate can lead to more overseas investment, pushing up demand for the Rupee. A less negative balance of trade will eventually lead to a stronger Rupee. Higher interest rates, especially real rates (interest rates less inflation) are also positive for the Rupee. A risk-on environment can lead to greater inflows of Foreign Direct and Indirect Investment (FDI and FII), which also benefit the Rupee.
Higher inflation, particularly, if it is comparatively higher than India’s peers, is generally negative for the currency as it reflects devaluation through oversupply. Inflation also increases the cost of exports, leading to more Rupees being sold to purchase foreign imports, which is Rupee-negative. At the same time, higher inflation usually leads to the Reserve Bank of India (RBI) raising interest rates and this can be positive for the Rupee, due to increased demand from international investors. The opposite effect is true of lower inflation.
Recommended Articles


