EUR/GBP Price Forecast: Correction ends and downtrend resumes

Source Fxstreet
  • EUR/GBP ends its pullback and resumes its bearish tempo. 
  • The RSI is converging bullishly with price, however, signifying a lack of bearish momentum accompanies the latest move.

EUR/GBP has finished pulling back and resumed its downtrend. It has broken below the 0.8317 September 24 low, confirming a lower low and extension towards the next target at 0.8287, the August 2022 low. 

It remains in a downtrend on a short and medium-term basis, and given the principle that “the trend is your friend” the odds favor an extension.

EUR/GBP Daily Chart 

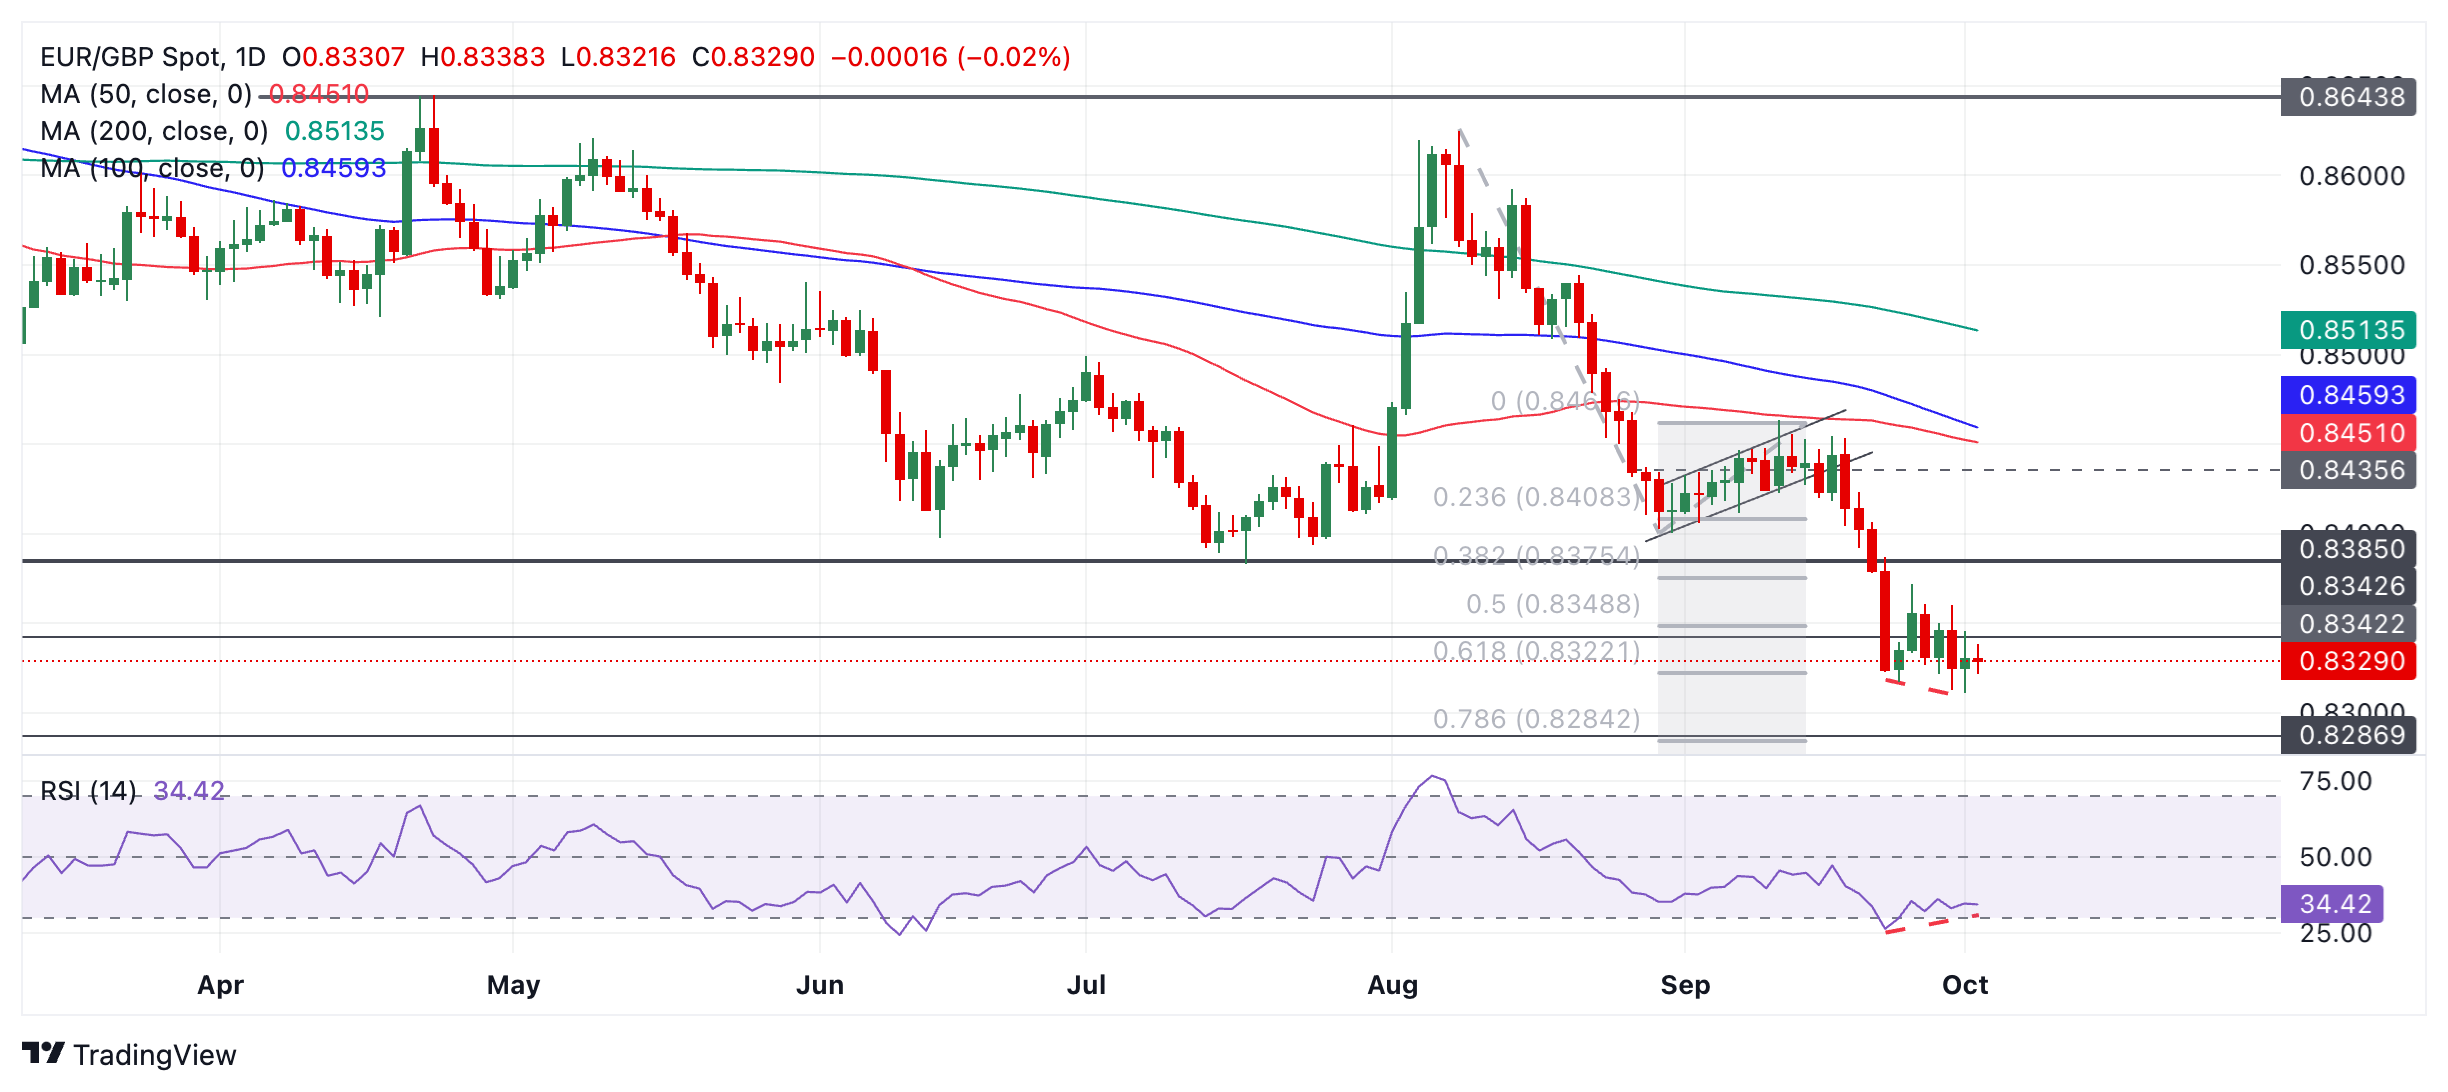
That said, the Relative Strength Index (RSI) is converging bullishly with price when comparing the September 24 low with the lower low of October 1 (red dashed lines on chart). Although the price has declined, the RSI has not. This signifies a lack of downside momentum accompanies the latest sell-off. This increases the risks it could stall or even pullback. 

EUR/GBP has already reached the conservative target for the bear move that began at the August 5 high, at 0.8322. This is the 61.8% extrapolation of the August sell-off. Further downside beyond the target, therefore, could be characterized as “higher hanging fruit” and the whole downward move since the August 5 high may even have completely run its course.


Disclaimer: For information purposes only. Past performance is not indicative of future results.
placeholder
Bitcoin Suffers Year’s Strongest Waterfall-Style Decline. Will It Next Drop to the $60,000 Mark?During the Asian trading session on June 4, Bitcoin continued its multi-day slump, briefly dropping below the $62,000 mark to $61,338. As of press time, Bitcoin was trading at $63,844, wi
Author  TradingKey
7 hours ago
During the Asian trading session on June 4, Bitcoin continued its multi-day slump, briefly dropping below the $62,000 mark to $61,338. As of press time, Bitcoin was trading at $63,844, wi
placeholder
Bitcoin drops below $65K amid reinforced bear market signalsBitcoin (BTC) dipped further below $65,000 on Wednesday, with onchain data from Glassnode signaling a market firmly in a bear phase. The decline has pushed prices back into a key valuation range between the Realized Price and the True Market Mean.
Author  FXStreet
16 hours ago
Bitcoin (BTC) dipped further below $65,000 on Wednesday, with onchain data from Glassnode signaling a market firmly in a bear phase. The decline has pushed prices back into a key valuation range between the Realized Price and the True Market Mean.
placeholder
Forex Today: US Dollar stays resilient ahead of key US dataHere is what you need to know on Wednesday, June 3:
Author  FXStreet
Yesterday 10: 27
Here is what you need to know on Wednesday, June 3:
placeholder
$1.5 Billion in Crypto Assets Liquidated, Bitcoin Falls Below $66,000 Mark. What Is the Reason?On June 2, Eastern Time, the cryptocurrency market suffered its most severe wave of concentrated liquidations so far this year. Bitcoin ( BTC) fell below the $70,000 psychological support
Author  TradingKey
Yesterday 06: 32
On June 2, Eastern Time, the cryptocurrency market suffered its most severe wave of concentrated liquidations so far this year. Bitcoin ( BTC) fell below the $70,000 psychological support
placeholder
WTI rises to near $93.00 as Iran launches missiles toward Kuwait, BahrainWest Texas Intermediate (WTI) gains ground for the third successive day, trading around $92.90 per barrel during the Asian hours on Wednesday.
Author  FXStreet
Yesterday 01: 24
West Texas Intermediate (WTI) gains ground for the third successive day, trading around $92.90 per barrel during the Asian hours on Wednesday.
Related Instrument
goTop
quote