

AUD/JPY trades with mild gains, bulls struggle to gain further ground
- The AUD/JPY experiences mild gains, currently standing at 97.40.
- Monetary policy divergences between the RBA and BoJ benefit the AUD.
- Before the RBA meets next week markets will get Retail Sales from December and Q4 CPI.
- The daily chart indicators sends mixed signals with, positive RSI a neutral MACD which suggests stagnant momentum.
On Monday's session, the AUD/JPY was seen trading at 97.40, shedding off mild gains after peaking at a high of 97.75. The overall view on the daily chart suggests a neutral to bullish trend, however, the bulls are facing obstacles in gaining further ground. Conversely, the four-hour outlook indicates bears have started to reign in, transforming the broader aspect of the technical landscape. In that sense, markets remain cautious awaiting further data to place their bets on the next Reserve Bank of Australia (RBA) decisions.
In that sense, RBA’s next week’s rate decision will be pivotal. Governor Bullock warned recently that inflation may take a little longer to normalize which made markets bet on a more aggressive stance so the messaging from the bank will be key. This week, Australia will release December Retail Sales figures from December, and on Wednesday, Q4 Consumer Price Index report, which may also set the pace of the AUD price dynamics.
AUD/JPY levels to watch
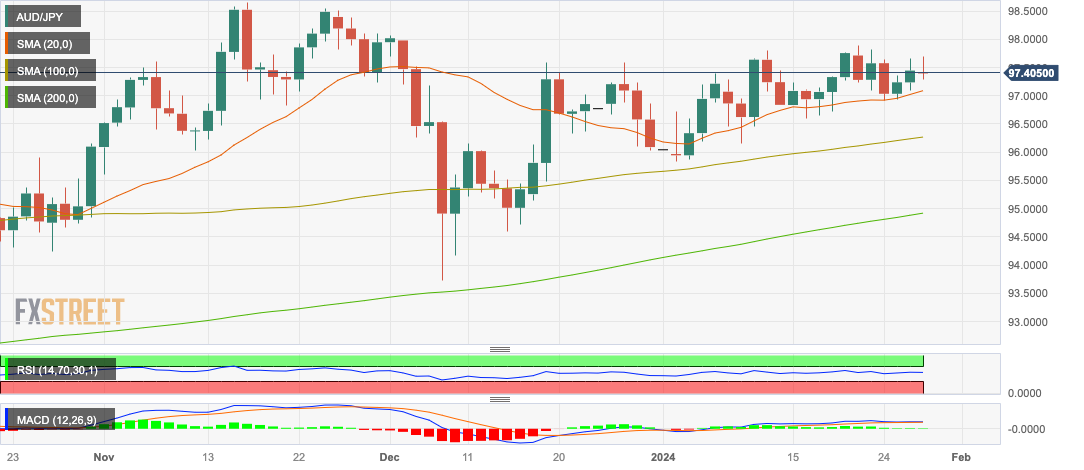
The overall view on the daily chart suggests a neutral to bullish trend, however, the bulls are facing obstacles in gaining further ground. The Relative Strength Index (RSI) is painting a positive picture given its upward tilt in the positive territory, indicating a strong buying momentum persisting in the market. However, the Moving Average Convergence Divergence (MACD) showing flat green bars signifies that the bullish sentiment is still dominant but that it is running out of steam. That being said, the pair’s positioning above all the 20,100, and 200-day Simple Moving Averages (SMAs), suggests a bullish inclination in the broader frame, despite the bulls struggling to gain additional ground recently.
Assessing from the short-term four-hour chart, a slightly contrary momentum is noticed. The bears seem to be gradually gaining some strength, making their presence felt. The four-hour RSI is sliding in the positive territory, indicating a potential shift towards a selling momentum, although it's in early stages. The MACD depicting flat green bars confirms that the bulls momentum is waning. Nevertheless, the subtle shift suggests that the buyers need to be cautious as the shorter time frame may be hinting towards a possible change in momentum.
AUD/JPY daily chart
Recommended Articles


