EUR/GBP Price Analysis: Technical outlook favors the downside as selling pressure mounts

Source Fxstreet
  • EUR/GBP weakens further, and buying pressure continues to retreat.
  • The latest price action and technical indicators suggest that further downside is on the table.
  • The 0.8380 presents a strong barrier against the sellers.

Thursday's session saw the EUR/GBP slightly decline by 0.20% below 0.8400. Looking at the technicals the overall bias remains bearish as selling pressure intensifies, the cross must hold the 0.8380 line to avoid further losses.

The Relative Strength Index (RSI) is currently at 37 and is declining sharply in the negative area, indicating that selling pressure is rising. Moreover, the Moving Average Convergence Divergence (MACD) also suggests that selling pressure is rising, as the histogram is red and rising. 

EUR/GBP daily chart

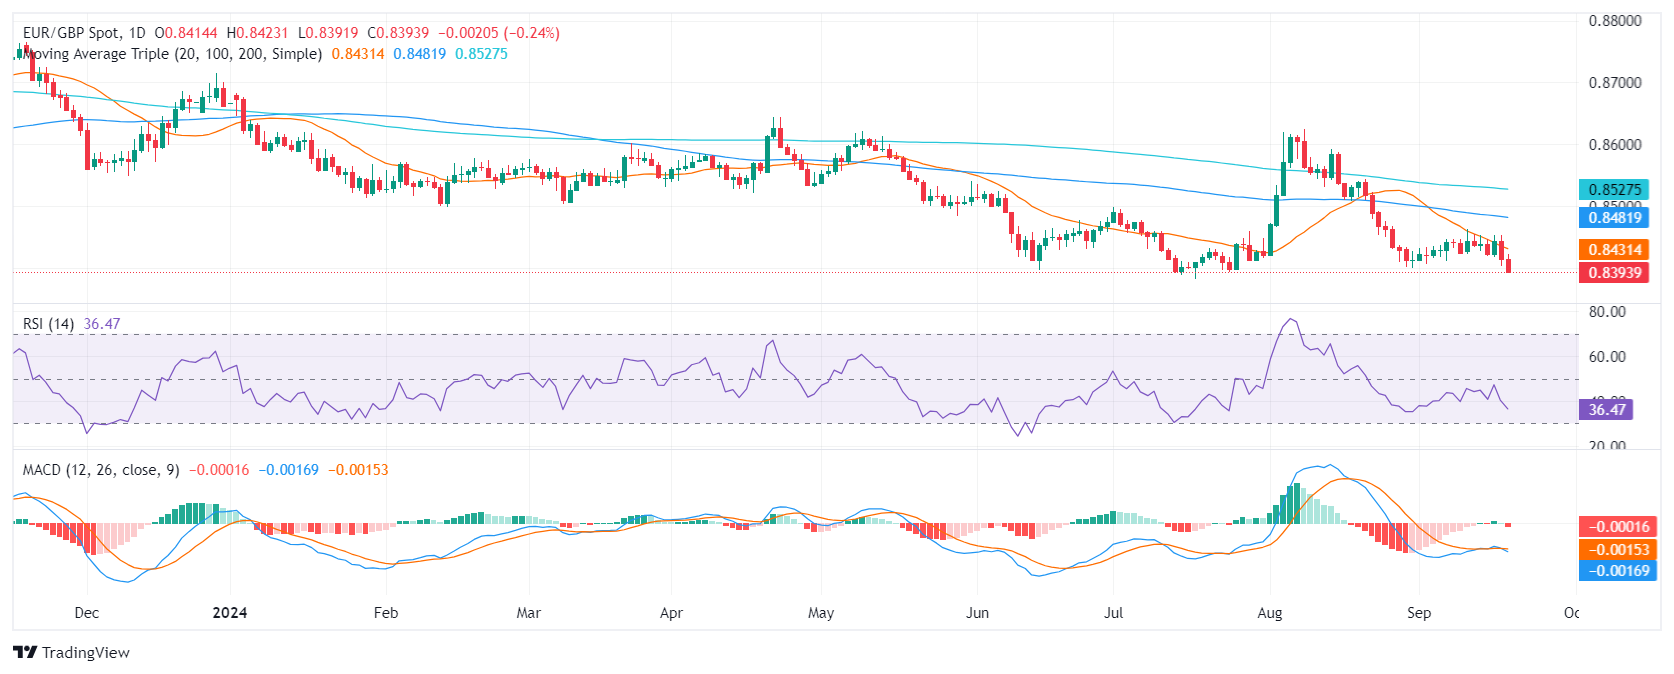
Based on the current technical picture, the EUR/GBP is likely to continue trading lower and support levels can be found at 0.8380, 0.8350, and 0.8330.  Resistance levels can be found at 0.8430 (20-day SMA), 0.8450, and 0.8500. The 0.8380 is a strong support which if breached would mark a low since 2022 and would confirm a negative outlook for the cross.


Disclaimer: For information purposes only. Past performance is not indicative of future results.
placeholder
The Ultimate Test for the Market: What Nvidia's Earnings Mean for U.S. StocksTradingKey - Nvidia (NVDA), the leader in the AI chip market, is set to release its fiscal year 2026 Q3 earnings report after the close of US markets on Wednesday. As US investors engage in a frantic
Author  TradingKey
9 hours ago
TradingKey - Nvidia (NVDA), the leader in the AI chip market, is set to release its fiscal year 2026 Q3 earnings report after the close of US markets on Wednesday. As US investors engage in a frantic
placeholder
Top 3 Price Prediction: Bitcoin, Ethereum, Ripple – BTC, ETH and XRP Look for a Foothold After a Sharp ShakeoutBitcoin trades near $92,600 after a dip below $90,000, while Ethereum around $3,118 and XRP near $2.21–$2.23 sit on key support zones, as BTC, ETH and XRP all try to turn a sharp correction into a tradable rebound rather than a deeper slide.
Author  Mitrade
12 hours ago
Bitcoin trades near $92,600 after a dip below $90,000, while Ethereum around $3,118 and XRP near $2.21–$2.23 sit on key support zones, as BTC, ETH and XRP all try to turn a sharp correction into a tradable rebound rather than a deeper slide.
placeholder
Bitcoin Falls Below $90K: BitMine & Bitwise Executives Predict Market Bottom This Week​Bitcoin's recent drop below $90,000 may signal a market bottom, according to industry leaders.
Author  Mitrade
13 hours ago
​Bitcoin's recent drop below $90,000 may signal a market bottom, according to industry leaders.
placeholder
Australian Dollar holds losses following Q3 Wage Price Index dataThe Australian Dollar (AUD) declines against the US Dollar (USD) on Wednesday after registering more than 0.25% gains in the previous session. The AUD/USD pair remains subdued after the release of medium-impact Wage Price Index data for the third quarter.
Author  FXStreet
17 hours ago
The Australian Dollar (AUD) declines against the US Dollar (USD) on Wednesday after registering more than 0.25% gains in the previous session. The AUD/USD pair remains subdued after the release of medium-impact Wage Price Index data for the third quarter.
placeholder
U.S. September Nonfarm Payrolls: Two-Scenario Analysis, Will U.S. Stocks Diverge in Short-Term and Medium-to-Long-Term Trends?1. IntroductionAffected by the U.S. government shutdown, the September nonfarm payrolls report—originally scheduled for release in early October—will be officially published on 20 November. As a key "
Author  TradingKey
Yesterday 10: 18
1. IntroductionAffected by the U.S. government shutdown, the September nonfarm payrolls report—originally scheduled for release in early October—will be officially published on 20 November. As a key "
goTop
quote