Australian Dollar edges lower due to rising concerns over Chinese economic outlook

Source Fxstreet
  • The Australian Dollar depreciates as analysts noted that the weak economic data indicates serious challenges for the China’s economic outlook.
  • The Aussie Dollar’s downside could be restrained due to hawkish sentiment surrounding the Reserve Bank of Australia’s policy outlook.
  • The US Dollar struggles due to rising odds of the Federal Reserve implementing a bumper rate cut on Wednesday.

The Australian Dollar (AUD) retraces its recent gains against the US Dollar (USD) on Tuesday, largely due to growing concerns over the health of China's economy. Analysts point out that the latest round of weak economic data indicates serious challenges for the world's second-largest economy. Since China is a key trading partner for Australia, fluctuations in China's economic health can have a significant effect on the Australian market.

Economists at Goldman Sachs and Citi have reduced their 2024 GDP growth forecasts for China to 4.7%, falling short of Beijing's target of around 5.0%. SocGen describes the situation as a "downward spiral," while Barclays calls it "from bad to worse" and a "vicious cycle." Morgan Stanley also cautions that "things could get worse before they get better," according to a Reuters report.

The AUD/USD pair’s downside may be limited, as the Australian Dollar remains supported by the Reserve Bank of Australia's (RBA) hawkish stance. Meanwhile, the US Dollar faces pressure amid increasing expectations that the US Federal Reserve (Fed) may implement an aggressive 50 basis points rate cut on Wednesday.

According to the CME FedWatch Tool, markets anticipate 38.0% odds of a 25 basis point (bps) rate cut by the Fed at its September meeting. The likelihood of a 50 bps rate cut has increased to 62.0%, up from 50.0% a day ago.

Daily Digest Market Movers: Australian Dollar inches lower due to fears over China's outlook

  • ANZ-Roy Morgan Consumer Confidence climbed 1.8 points, reaching an eight-week high of 84.1. While ANZ notes that the rise was broad-based, confidence remains firmly in pessimistic territory.
  • The University of Michigan’s Consumer Sentiment Index rose to 69.0 in September, exceeding the market expectations of 68.0 reading and marking a four-month high. This increase reflects a gradual improvement in consumers' outlook on the US economy after months of declining economic expectations.
  • China's economy weakened in August, with a continued slowdown in industrial activity and declining real estate prices, as Beijing faces growing pressure to increase spending to boost demand. According to Business Standard, this was reported by the National Bureau of Statistics on Saturday.
  • China's Retail Sales grew by 2.1% year-on-year in August, slowing from 2.7% in the previous month and falling short of the market consensus of 2.5%.
  • The US Producer Price Index (PPI) rose to 0.2% month-on-month in August, exceeding the forecasted 0.1% increase and the previous 0.0%. Meanwhile, core PPI accelerated to 0.3% MoM, against the expected 0.2% rise and July’s 0.2% contraction.
  • Australia’s Consumer Inflation Expectations eased to 4.4% in September, down slightly from August's four-month high of 4.5%. This decline highlights the central bank's efforts to balance bringing inflation down within a reasonable timeframe and maintaining gains in the labor market.
  • The Reserve Bank of Australia (RBA) has maintained a hawkish stance, with RBA Governor Michele Bullock stating that it is premature to consider rate cuts due to persistently high inflation. RBA Assistant Governor Sarah Hunter also noted that while the labor market remains tight, wage growth appears to have peaked and is expected to slow further.

Technical Analysis: Australian Dollar rises to 0.6750; next barrier at seven-month highs

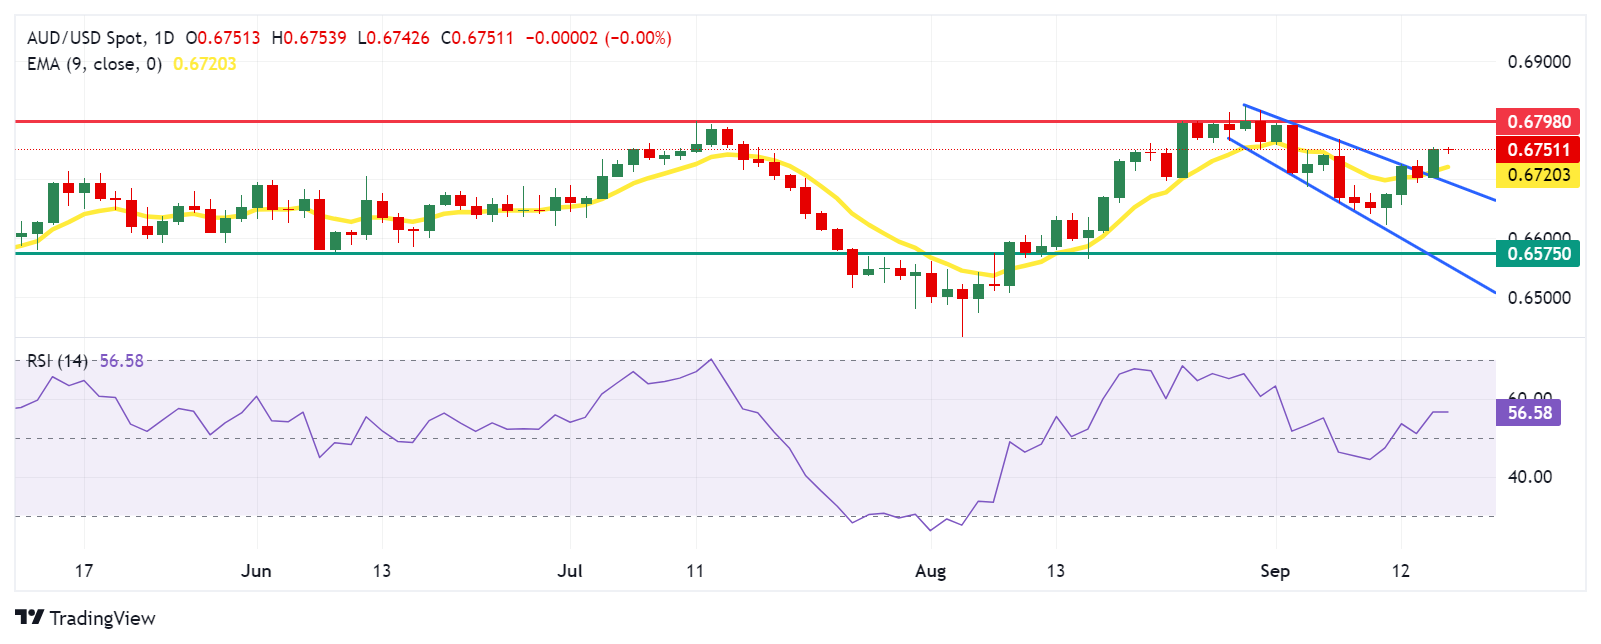
The AUD/USD pair trades near 0.6750 on Tuesday. Technical analysis of the daily chart indicates that the pair has broken above the upper boundary of a descending channel, indicating a weakening of a bearish bias. Additionally, the 14-day Relative Strength Index (RSI) is positioned slightly above the 50 level, suggesting a shift in momentum from a bearish to a bullish trend.

Regarding the upside, a breach above the descending channel has triggered a bullish bias for the AUD/USD pair. This could push the pair toward its seven-month high of 0.6798 and test the psychological level of 0.6800.

On the downside, the AUD/USD pair could find immediate support around the nine-day Exponential Moving Average (EMA) at the 0.6719 level, followed by the upper boundary of the descending channel at 0.6690. A return to the descending channel would reinforce the bearish bias and lead the pair to navigate the region around the throwback support zone near 0.6575, followed by the lower boundary of the descending channel at 0.6550 level.

AUD/USD: Daily Chart

Australian Dollar PRICE Today

The table below shows the percentage change of Australian Dollar (AUD) against listed major currencies today. Australian Dollar was the weakest against the Japanese Yen.

  USD EUR GBP JPY CAD AUD NZD CHF
USD   0.05% 0.08% -0.10% 0.03% 0.00% 0.18% -0.05%
EUR -0.05%   0.03% -0.16% -0.06% -0.06% 0.12% -0.10%
GBP -0.08% -0.03%   -0.19% -0.06% -0.08% 0.10% -0.15%
JPY 0.10% 0.16% 0.19%   0.14% 0.12% 0.30% 0.05%
CAD -0.03% 0.06% 0.06% -0.14%   -0.02% 0.17% -0.09%
AUD -0.01% 0.06% 0.08% -0.12% 0.02%   0.17% -0.08%
NZD -0.18% -0.12% -0.10% -0.30% -0.17% -0.17%   -0.25%
CHF 0.05% 0.10% 0.15% -0.05% 0.09% 0.08% 0.25%  

The heat map shows percentage changes of major currencies against each other. The base currency is picked from the left column, while the quote currency is picked from the top row. For example, if you pick the Australian Dollar from the left column and move along the horizontal line to the US Dollar, the percentage change displayed in the box will represent AUD (base)/USD (quote).

Australian Dollar FAQs

One of the most significant factors for the Australian Dollar (AUD) is the level of interest rates set by the Reserve Bank of Australia (RBA). Because Australia is a resource-rich country another key driver is the price of its biggest export, Iron Ore. The health of the Chinese economy, its largest trading partner, is a factor, as well as inflation in Australia, its growth rate and Trade Balance. Market sentiment – whether investors are taking on more risky assets (risk-on) or seeking safe-havens (risk-off) – is also a factor, with risk-on positive for AUD.

The Reserve Bank of Australia (RBA) influences the Australian Dollar (AUD) by setting the level of interest rates that Australian banks can lend to each other. This influences the level of interest rates in the economy as a whole. The main goal of the RBA is to maintain a stable inflation rate of 2-3% by adjusting interest rates up or down. Relatively high interest rates compared to other major central banks support the AUD, and the opposite for relatively low. The RBA can also use quantitative easing and tightening to influence credit conditions, with the former AUD-negative and the latter AUD-positive.

China is Australia’s largest trading partner so the health of the Chinese economy is a major influence on the value of the Australian Dollar (AUD). When the Chinese economy is doing well it purchases more raw materials, goods and services from Australia, lifting demand for the AUD, and pushing up its value. The opposite is the case when the Chinese economy is not growing as fast as expected. Positive or negative surprises in Chinese growth data, therefore, often have a direct impact on the Australian Dollar and its pairs.

Iron Ore is Australia’s largest export, accounting for $118 billion a year according to data from 2021, with China as its primary destination. The price of Iron Ore, therefore, can be a driver of the Australian Dollar. Generally, if the price of Iron Ore rises, AUD also goes up, as aggregate demand for the currency increases. The opposite is the case if the price of Iron Ore falls. Higher Iron Ore prices also tend to result in a greater likelihood of a positive Trade Balance for Australia, which is also positive of the AUD.

The Trade Balance, which is the difference between what a country earns from its exports versus what it pays for its imports, is another factor that can influence the value of the Australian Dollar. If Australia produces highly sought after exports, then its currency will gain in value purely from the surplus demand created from foreign buyers seeking to purchase its exports versus what it spends to purchase imports. Therefore, a positive net Trade Balance strengthens the AUD, with the opposite effect if the Trade Balance is negative.

Disclaimer: For information purposes only. Past performance is not indicative of future results.
placeholder
Gold Price Forecast: XAU/USD drifts higher above $4,200 as Fed delivers expected cutGold price (XAU/USD) gains momentum to around $4,235 during the early Asian session on Thursday. The precious metal extends its upside after the US Federal Reserve (Fed) delivered an expected third consecutive interest rate cut and maintained its outlook for just one cut in 2026.
Author  FXStreet
Dec 11, Thu
Gold price (XAU/USD) gains momentum to around $4,235 during the early Asian session on Thursday. The precious metal extends its upside after the US Federal Reserve (Fed) delivered an expected third consecutive interest rate cut and maintained its outlook for just one cut in 2026.
placeholder
Gold remains bid as lack of Fed clarity and geopolitical frictions persistGold (XAU/USD) advances modestly on Friday as traders seem to book profits ahead of the weekend, yet clings to gains of over 0.51% after reaching a seven-week high of $4,353. At the time of writing, XAU/USD trades at $4,302 as traders digest comments from Federal Reserve (Fed) officials.
Author  FXStreet
Yesterday 01: 34
Gold (XAU/USD) advances modestly on Friday as traders seem to book profits ahead of the weekend, yet clings to gains of over 0.51% after reaching a seven-week high of $4,353. At the time of writing, XAU/USD trades at $4,302 as traders digest comments from Federal Reserve (Fed) officials.
placeholder
Ethereum Price Slips Lower — $3,000 Looms as the Key BattlegroundEthereum is attempting to recover from a $3,026 low but remains below $3,200 and the 100-hour SMA, with a bearish trend line near $3,175 capping rebounds as bulls need a clean break above $3,200 to target $3,250–$3,400, while a drop below $3,050 risks a retest of $3,000 and $2,940.
Author  Mitrade
Yesterday 03: 25
Ethereum is attempting to recover from a $3,026 low but remains below $3,200 and the 100-hour SMA, with a bearish trend line near $3,175 capping rebounds as bulls need a clean break above $3,200 to target $3,250–$3,400, while a drop below $3,050 risks a retest of $3,000 and $2,940.
placeholder
Macro Analysts: Hawkish Japan Could Push Bitcoin Below $70KAnalysts predict Bitcoin may face further declines towards the $70,000 mark if the Bank of Japan raises interest rates as expected.
Author  Mitrade
Yesterday 05: 48
Analysts predict Bitcoin may face further declines towards the $70,000 mark if the Bank of Japan raises interest rates as expected.
placeholder
Bitcoin Slides 5% as Sellers Lean In — Can BTC Reclaim $88,000?Bitcoin has dropped back below $88,000 after rolling over from $90,500, with price still trading under the 100-hour Simple Moving Average. The sell-off found a floor at $85,151, and BTC is now consolidating near that base, but rebounds are facing pressure from a bearish trend line around $89,000. Bulls need to retake $88,000–$89,000 to ease downside risk; failure to do so keeps $85,500–$85,000 and then $83,500 in play, with $80,000 as the deeper “line in the sand.” Bitcoin (BTC) is back in damage-control mode after a sharp pullback wiped out recent gains. The price failed to reclaim the $90,000–$90,500 band, rolled over, and slid through $88,500 before briefly dipping under $87,000. Buyers did show up around $85,000, but the rebound so far looks more like stabilization than a clear trend reversal. Bitcoin dips hard, finds a bid near $85,000(h3) BTC’s latest move lower began when it couldn’t build follow-through above $90,000 and $90,500. Once that upside stalled, sellers took control and pushed price down through $88,500. The slide accelerated enough to spike below $87,000, but the market didn’t free-fall. Bulls defended the $85,000 zone, printing a low at $85,151. Since then, Bitcoin has been consolidating below the 23.6% Fibonacci retracement of the drop from the $93,560 swing high to the $85,151 low — a clue that the bounce is still shallow and that sellers haven’t fully backed off yet. Structurally, BTC is still on the back foot: It’s trading below $88,000, and It remains below the 100-hour Simple Moving Average, keeping short-term trend pressure pointed downward. Resistance is layered, and $89,000 is the problem area(h3) If bulls try to turn this into a recovery, they’ll have to climb through multiple ceilings in quick succession. First, BTC faces resistance around $87,150, followed by a more meaningful barrier near $87,500. From there, the market’s attention snaps back to $88,000 — the level BTC just lost and now needs to reclaim. A close back above $88,000 would improve the tone, but it doesn’t solve the bigger issue: there’s a bearish trend line on the hourly BTC/USD chart (Kraken feed) with resistance near $89,000, which also lines up with the next technical hurdle. If BTC can push through $89,000 and hold, the rebound could extend toward $90,000, with follow-through targets at $91,000 and $91,500. But until price clears that $88,000–$89,000 zone, rallies are at risk of being sold rather than chased. If BTC fails to reclaim resistance, the downside path is clear(h3) The near-term bear case is simple: if Bitcoin can’t climb back above the $87,000 area and keep traction, sellers may attempt another leg lower. Support levels line up like this: Immediate support: $85,500 First major support: $85,000 Next support: $83,500 Then $82,500 in the near term Below that, the major “don’t break this” level is still $80,000. If BTC slips under $80,000, the risk of acceleration to the downside increases significantly — not because it’s magic, but because it’s the kind of psychological and structural level that tends to trigger forced de-risking. Indicators: momentum still leans bearish(h3) The intraday indicators aren’t offering much comfort yet: Hourly MACD is losing pace in the bearish zone. Hourly RSI remains below 50, suggesting sellers still have the upper hand on short timeframes. So while the $85,000 defense held for now, the market hasn’t flipped bullish — it’s just stopped bleeding.
Author  Mitrade
7 hours ago
Bitcoin has dropped back below $88,000 after rolling over from $90,500, with price still trading under the 100-hour Simple Moving Average. The sell-off found a floor at $85,151, and BTC is now consolidating near that base, but rebounds are facing pressure from a bearish trend line around $89,000. Bulls need to retake $88,000–$89,000 to ease downside risk; failure to do so keeps $85,500–$85,000 and then $83,500 in play, with $80,000 as the deeper “line in the sand.” Bitcoin (BTC) is back in damage-control mode after a sharp pullback wiped out recent gains. The price failed to reclaim the $90,000–$90,500 band, rolled over, and slid through $88,500 before briefly dipping under $87,000. Buyers did show up around $85,000, but the rebound so far looks more like stabilization than a clear trend reversal. Bitcoin dips hard, finds a bid near $85,000(h3) BTC’s latest move lower began when it couldn’t build follow-through above $90,000 and $90,500. Once that upside stalled, sellers took control and pushed price down through $88,500. The slide accelerated enough to spike below $87,000, but the market didn’t free-fall. Bulls defended the $85,000 zone, printing a low at $85,151. Since then, Bitcoin has been consolidating below the 23.6% Fibonacci retracement of the drop from the $93,560 swing high to the $85,151 low — a clue that the bounce is still shallow and that sellers haven’t fully backed off yet. Structurally, BTC is still on the back foot: It’s trading below $88,000, and It remains below the 100-hour Simple Moving Average, keeping short-term trend pressure pointed downward. Resistance is layered, and $89,000 is the problem area(h3) If bulls try to turn this into a recovery, they’ll have to climb through multiple ceilings in quick succession. First, BTC faces resistance around $87,150, followed by a more meaningful barrier near $87,500. From there, the market’s attention snaps back to $88,000 — the level BTC just lost and now needs to reclaim. A close back above $88,000 would improve the tone, but it doesn’t solve the bigger issue: there’s a bearish trend line on the hourly BTC/USD chart (Kraken feed) with resistance near $89,000, which also lines up with the next technical hurdle. If BTC can push through $89,000 and hold, the rebound could extend toward $90,000, with follow-through targets at $91,000 and $91,500. But until price clears that $88,000–$89,000 zone, rallies are at risk of being sold rather than chased. If BTC fails to reclaim resistance, the downside path is clear(h3) The near-term bear case is simple: if Bitcoin can’t climb back above the $87,000 area and keep traction, sellers may attempt another leg lower. Support levels line up like this: Immediate support: $85,500 First major support: $85,000 Next support: $83,500 Then $82,500 in the near term Below that, the major “don’t break this” level is still $80,000. If BTC slips under $80,000, the risk of acceleration to the downside increases significantly — not because it’s magic, but because it’s the kind of psychological and structural level that tends to trigger forced de-risking. Indicators: momentum still leans bearish(h3) The intraday indicators aren’t offering much comfort yet: Hourly MACD is losing pace in the bearish zone. Hourly RSI remains below 50, suggesting sellers still have the upper hand on short timeframes. So while the $85,000 defense held for now, the market hasn’t flipped bullish — it’s just stopped bleeding.
goTop
quote