

EUR/JPY Price Forecast: Rises above 156.00 as bulls face key resistance area
- EUR/JPY remains in a bearish bias despite recent recovery, with momentum flattening and potential consolidation ahead.
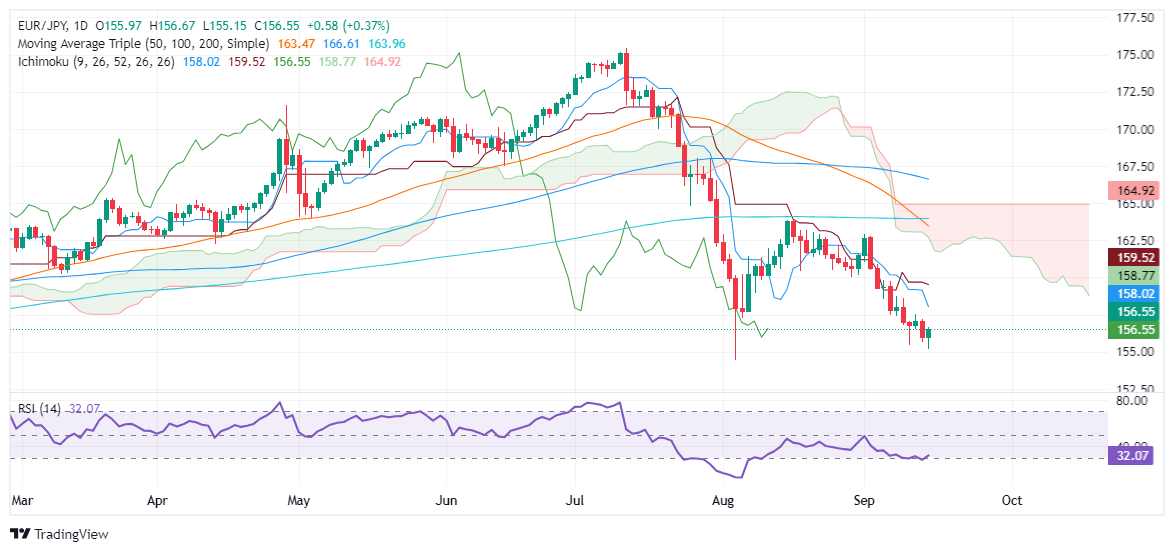
- A break above 157.00 could target resistance at 157.46 (Tenkan-Sen) and 158.49 (Senkou Span A).
- For a bearish continuation, EUR/JPY must fall below 155.14, with the YTD low at 154.39 as the next support level.
The EUR/JPY recovered some ground on Monday, registering gains of over 0.40% and climbing past the 156.00 figure. As Tuesday’s Asian session begins, the cross-currency pair exchanges hands at 156.51, virtually unchanged.
Last week, the European Central Bank (ECB) lowered rates by 0.25%, yet signaled that it would most likely pause at the October meeting due to the lack of data policymakers would have at their disposal. This boosted the Euro, though the jump could be short-lived as a Bank of Japan (BoJ) monetary policy decision looms.
EUR/JPY Price Forecast: Technical outlook
The pair remains downward biased despite recovering from an over 4.70% fall. The momentum is bearish but has flatlined, hinting that consolidation lies ahead. That said, the EUR/JPY could remain range-bound within a 150-pip volatility range.
If EUR/JPY climbs above 157.00, the next resistance will be the Tenkan-Sen at 157.46. A breach of the latter will expose the Senkou Span A at 158.49, followed by the Kijun-Sen at 159.52.
Conversely, for a bearish continuation, EUR/JPY must drop below the September 16 low of 155.14. The next support would be the year-to-date (YTD) low of 154.39.
EUR/JPY Price Action – Daily Chart
Euro PRICE Today
The table below shows the percentage change of Euro (EUR) against listed major currencies today. Euro was the strongest against the Swiss Franc.
| USD | EUR | GBP | JPY | CAD | AUD | NZD | CHF | |
|---|---|---|---|---|---|---|---|---|
| USD | 0.00% | 0.02% | 0.01% | -0.01% | -0.01% | -0.03% | 0.03% | |
| EUR | -0.01% | 0.00% | -0.02% | -0.03% | -0.02% | -0.04% | 0.03% | |
| GBP | -0.02% | -0.01% | 0.00% | -0.02% | -0.02% | -0.04% | -0.01% | |
| JPY | -0.01% | 0.02% | 0.00% | 0.01% | -0.02% | -0.03% | -0.02% | |
| CAD | 0.01% | 0.03% | 0.02% | -0.01% | 0.00% | -0.01% | 0.01% | |
| AUD | 0.00% | 0.02% | 0.02% | 0.02% | -0.00% | -0.01% | -0.02% | |
| NZD | 0.03% | 0.04% | 0.04% | 0.03% | 0.00% | 0.01% | 0.02% | |
| CHF | -0.03% | -0.03% | 0.00% | 0.02% | -0.01% | 0.02% | -0.02% |
The heat map shows percentage changes of major currencies against each other. The base currency is picked from the left column, while the quote currency is picked from the top row. For example, if you pick the Euro from the left column and move along the horizontal line to the US Dollar, the percentage change displayed in the box will represent EUR (base)/USD (quote).
Recommended Articles


