NZD/USD Price Analysis: Bulls push back and attempt to regain the 20-day SMA

Source Fxstreet
  • The NZD/USD pair has been trading choppily within a range between 0.6120 and 0.6200 in the last sessions.
  • The RSI is in positive territory with a rising slope, suggesting that buying pressure is increasing.

On Monday, the NZD/USD pair rose by 0.70% to 0.6200, as the bulls took control of the market. The pair has been trading choppily within a range between 0.6120 and 0.6200 in the last trading sessions. That being said, if the bulls gain the 20-day Simple Moving Average (SMA) consolidating above 0.6200, it could be considered a buy signal.

The Relative Strength Index (RSI) is currently at 56, which is in positive territory and has a rising slope, suggesting that the bulls are gaining momentum. However, the Moving Average Convergence Divergence (MACD) printed decreasing red bars, a sign of a potential reversal in the bearish momentum. This is aligned with the recent price action, which shows the bulls are pushing back.

NZD/USD daily chart

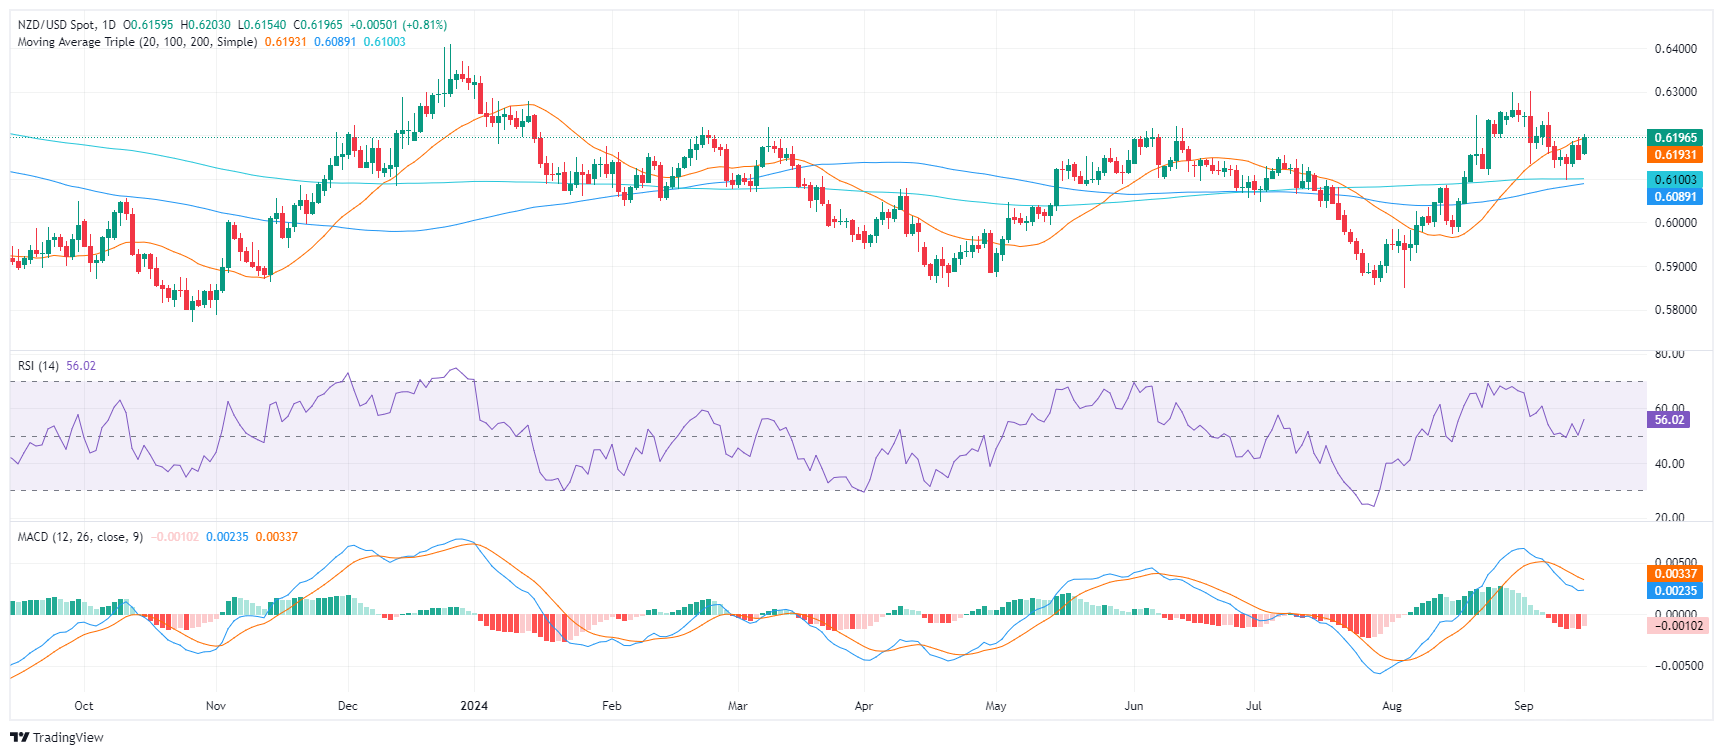
Key support levels to watch are 0.6120, 0.6140, and 0.6160, while resistance levels are 0.6200, 0.6220, and 0.6240. A consolidation above the 0.6200 area would put the pair back above the 20,100 and 200-days SMA which could trigger additional upward movements.


Disclaimer: For information purposes only. Past performance is not indicative of future results.
placeholder
Natural Gas sinks to pivotal level as China’s demand slumpsNatural Gas price (XNG/USD) edges lower and sinks to $2.56 on Monday, extending its losing streak for the fifth day in a row. The move comes on the back of China cutting its Liquified Natural Gas (LNG) imports after prices rose above $3.0 in June. It
Author  FXStreet
Jul 01, 2024
Natural Gas price (XNG/USD) edges lower and sinks to $2.56 on Monday, extending its losing streak for the fifth day in a row. The move comes on the back of China cutting its Liquified Natural Gas (LNG) imports after prices rose above $3.0 in June. It
placeholder
Markets in 2026: Will gold, Bitcoin, and the U.S. dollar make history again? — These are how leading institutions thinkAfter a turbulent 2025, what lies ahead for commodities, forex, and cryptocurrency markets in 2026?
Author  Insights
Dec 25, 2025
After a turbulent 2025, what lies ahead for commodities, forex, and cryptocurrency markets in 2026?
placeholder
My Top 5 Stock Market Predictions for 2026Five 2026 market predictions written in a native, news-style voice: AI’s winners and losers, broader sector leadership, dividend demand, valuation cooling as the Shiller CAPE sits at 39 (Dec. 31, 2025), and quantum-computing bursts—while keeping all original facts and numbers unchanged.
Author  Mitrade
Jan 06, Tue
Five 2026 market predictions written in a native, news-style voice: AI’s winners and losers, broader sector leadership, dividend demand, valuation cooling as the Shiller CAPE sits at 39 (Dec. 31, 2025), and quantum-computing bursts—while keeping all original facts and numbers unchanged.
placeholder
Silver Price Forecasts: XAG/USD approaches $78.00 boosted by Iran peace hopesSilver (XAG/USD) is rushing higher on Tuesday, reaching fresh two-week highs right below $78.00 at the time of writing, after bouncing from lows around $72.60 on Monday.
Author  TradingKey
Apr 14, Tue
Silver (XAG/USD) is rushing higher on Tuesday, reaching fresh two-week highs right below $78.00 at the time of writing, after bouncing from lows around $72.60 on Monday.
placeholder
Gold eases from four-week top as Hormuz risks temper USD weaknessGold (XAU/USD) hits a nearly four-week high during the Asian session on Wednesday, though it lacks follow-through buying and currently trades just below the $4,850 level, nearly unchanged for the day.
Author  FXStreet
Apr 15, Wed
Gold (XAU/USD) hits a nearly four-week high during the Asian session on Wednesday, though it lacks follow-through buying and currently trades just below the $4,850 level, nearly unchanged for the day.
Related Instrument
goTop
quote