

USD/JPY Price Forecast: Breaks below 142.00 on weak US Dollar
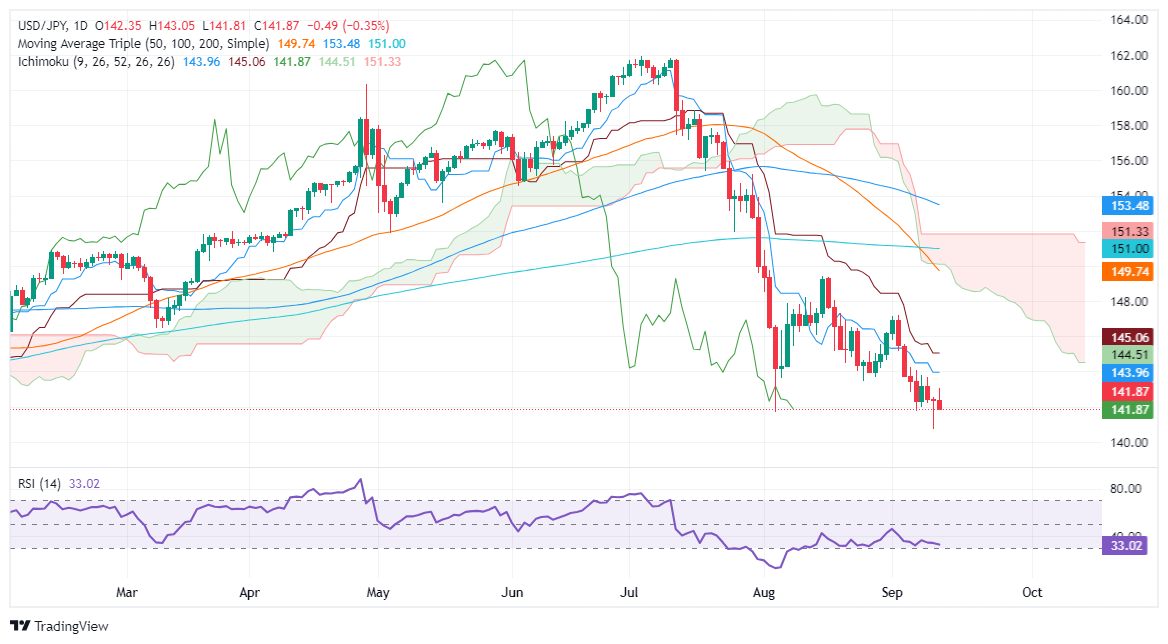
- USD/JPY remains downward biased, with a daily close below 142.00 signaling potential for further losses toward 140.71 and 140.25.
- Bears maintain control as RSI stays flat, indicating consolidation before the next move.
- On an upward correction, resistance lies at 142.00, followed by 143.04 and key levels at 143.96 (Tenkan-Sen) and 144.50 (Senkou Span A).
The USD/JPY fell from around 143.00 peak and lost over 0.28% due to mixed economic data from the United States (US), bolstering the odds for the Federal Reserve’s first rate cut next week. At the time of writing, the pair trades at 141.96.
USD/JPY Price Forecast: Technical outlook
The USD/JPY remains downward biased, but after Wednesday's long tail, it could face an upward correction and test key resistance levels.
Despite that, bears remain in charge as the Relative Strength Index (RSI) shows, though a flat slope, hints that consolidation lies ahead.
If USD/JPY achieves a daily close below 142.00, traders could drag prices toward the September 11 trough at 140.71. If cleared, the next stop would be December 28, 2023, with a cycle low of 140.25, ahead of 140.00.
On further strength, the first resistance would be the 142.00 mark. If hurdled, the next stop would be the September 12 high at 143.04, followed by the Tenkan-Sen at 143.96 and Senkou Span A at 144.50.
USD/JPY Price Action – Daily Chart
Japanese Yen FAQs
The Japanese Yen (JPY) is one of the world’s most traded currencies. Its value is broadly determined by the performance of the Japanese economy, but more specifically by the Bank of Japan’s policy, the differential between Japanese and US bond yields, or risk sentiment among traders, among other factors.
One of the Bank of Japan’s mandates is currency control, so its moves are key for the Yen. The BoJ has directly intervened in currency markets sometimes, generally to lower the value of the Yen, although it refrains from doing it often due to political concerns of its main trading partners. The current BoJ ultra-loose monetary policy, based on massive stimulus to the economy, has caused the Yen to depreciate against its main currency peers. This process has exacerbated more recently due to an increasing policy divergence between the Bank of Japan and other main central banks, which have opted to increase interest rates sharply to fight decades-high levels of inflation.
The BoJ’s stance of sticking to ultra-loose monetary policy has led to a widening policy divergence with other central banks, particularly with the US Federal Reserve. This supports a widening of the differential between the 10-year US and Japanese bonds, which favors the US Dollar against the Japanese Yen.
The Japanese Yen is often seen as a safe-haven investment. This means that in times of market stress, investors are more likely to put their money in the Japanese currency due to its supposed reliability and stability. Turbulent times are likely to strengthen the Yen’s value against other currencies seen as more risky to invest in.
Recommended Articles


