EUR/GBP Price Analysis: Bulls make a stride and challenge the 20-day SMA

Source Fxstreet
  • Technical indicators suggest a shift in momentum toward positive territory
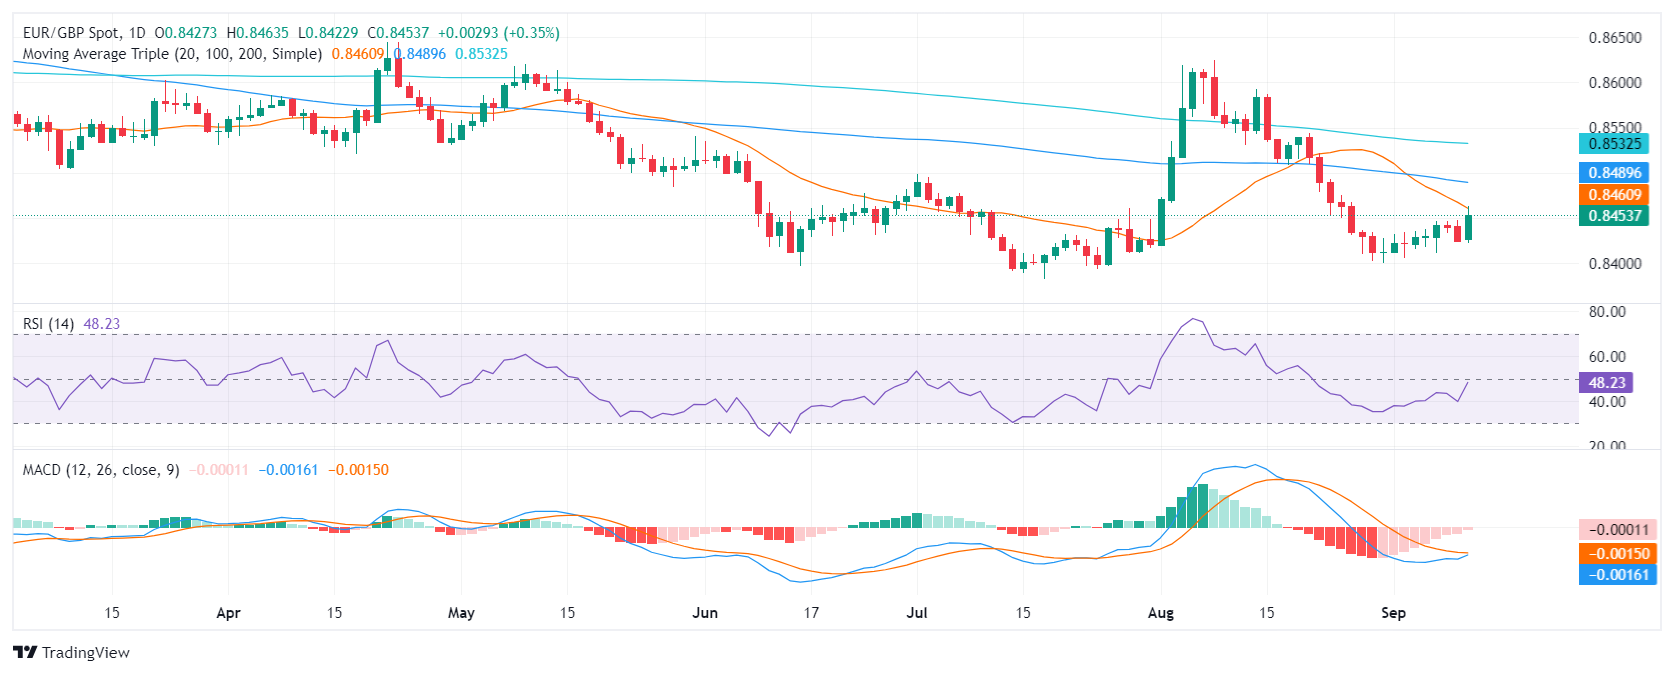
  • RSI rises near 50, indicating a recovery in buying pressure.
  • MACD continues printing decreasing red bars.

In Wednesday's session, when the EUR/GBP broke out and saw 0.40% gains to rise near 0.8450. While bulls made a huge step, they still have more work to do to confirm a recovery.

The Relative Strength Index (RSI) has moved back towards the 50 midpoint, signaling that buying pressure is recovering. This is supported by the flattening of the Moving Average Convergence Divergence (MACD) histogram, with the red bars decreasing and the histogram moving closer to the zero line. This suggests a potential shift in momentum toward positive territory.

However, the overall outlook remains cautious as the choppy and price action in recent candles suggests consolidation for the pair. While the pair has been holding above the 0.8400 support level, the next resistance level to watch is 0.8460 at the 20-day Simple Moving Average (SMA) and a break above could confirm a recovery.

EUR/GBP daily chart

Disclaimer: For information purposes only. Past performance is not indicative of future results.
placeholder
Natural Gas sinks to pivotal level as China’s demand slumpsNatural Gas price (XNG/USD) edges lower and sinks to $2.56 on Monday, extending its losing streak for the fifth day in a row. The move comes on the back of China cutting its Liquified Natural Gas (LNG) imports after prices rose above $3.0 in June. It
Author  FXStreet
Jul 01, 2024
Natural Gas price (XNG/USD) edges lower and sinks to $2.56 on Monday, extending its losing streak for the fifth day in a row. The move comes on the back of China cutting its Liquified Natural Gas (LNG) imports after prices rose above $3.0 in June. It
placeholder
Markets in 2026: Will gold, Bitcoin, and the U.S. dollar make history again? — These are how leading institutions thinkAfter a turbulent 2025, what lies ahead for commodities, forex, and cryptocurrency markets in 2026?
Author  Insights
Dec 25, 2025
After a turbulent 2025, what lies ahead for commodities, forex, and cryptocurrency markets in 2026?
placeholder
ECB Policy Outlook for 2026: What It Could Mean for the Euro’s Next MoveWith the ECB likely holding rates steady at 2.15% and the Fed potentially extending cuts into 2026, EUR/USD may test 1.20 if Eurozone growth proves resilient, but weaker growth and an ECB pivot could pull the pair back toward 1.13 and potentially 1.10.
Author  Mitrade
Dec 26, 2025
With the ECB likely holding rates steady at 2.15% and the Fed potentially extending cuts into 2026, EUR/USD may test 1.20 if Eurozone growth proves resilient, but weaker growth and an ECB pivot could pull the pair back toward 1.13 and potentially 1.10.
placeholder
WTI falls to near $93.50 after Israel, Iran signal an end to hostilitiesWest Texas Intermediate (WTI) oil price loses ground after registering modest gains in the previous day, trading around $93.70 per barrel during the Asian hours on Friday.
Author  FXStreet
May 08, Fri
West Texas Intermediate (WTI) oil price loses ground after registering modest gains in the previous day, trading around $93.70 per barrel during the Asian hours on Friday.
placeholder
Silver Price Analysis: Climbs above $80, as bulls eye weekly highSilver price advances more than 2.50% on Friday, set to end the week with gains of over 7% sponsored by US Dollar weakness and falling oil prices. At the time of writing, the XAG/USD trades at $80.72, after bouncing off daily lows of $78.16.
Author  FXStreet
23 hours ago
Silver price advances more than 2.50% on Friday, set to end the week with gains of over 7% sponsored by US Dollar weakness and falling oil prices. At the time of writing, the XAG/USD trades at $80.72, after bouncing off daily lows of $78.16.
Related Instrument
goTop
quote