NZD/JPY Price Analysis: Bears extend their control, aiming for 87.00

Source Fxstreet
  • The NZD/JPY pair fell sharply on Friday and reaching a low of 87.85.
  • The RSI has plunged to 36, indicating that the bears are in full control and the negative momentum is likely to persist.
  • Bears have the 87.00 threshold on their sight.

The NZD/JPY pair has maintained its bearish stance, extending the selloff that started in Tuesday's session. Technical indicators strongly suggest that the bears have the upper hand, and the pair could continue to decline in the coming days.

The Relative Strength Index (RSI) has reached 36 and approaches the oversold threshold. However, after the pair shed more than 3% this week, the cross might consolidate in the next sessions, as bears might run out of steam.

NZD/JPY daily chart

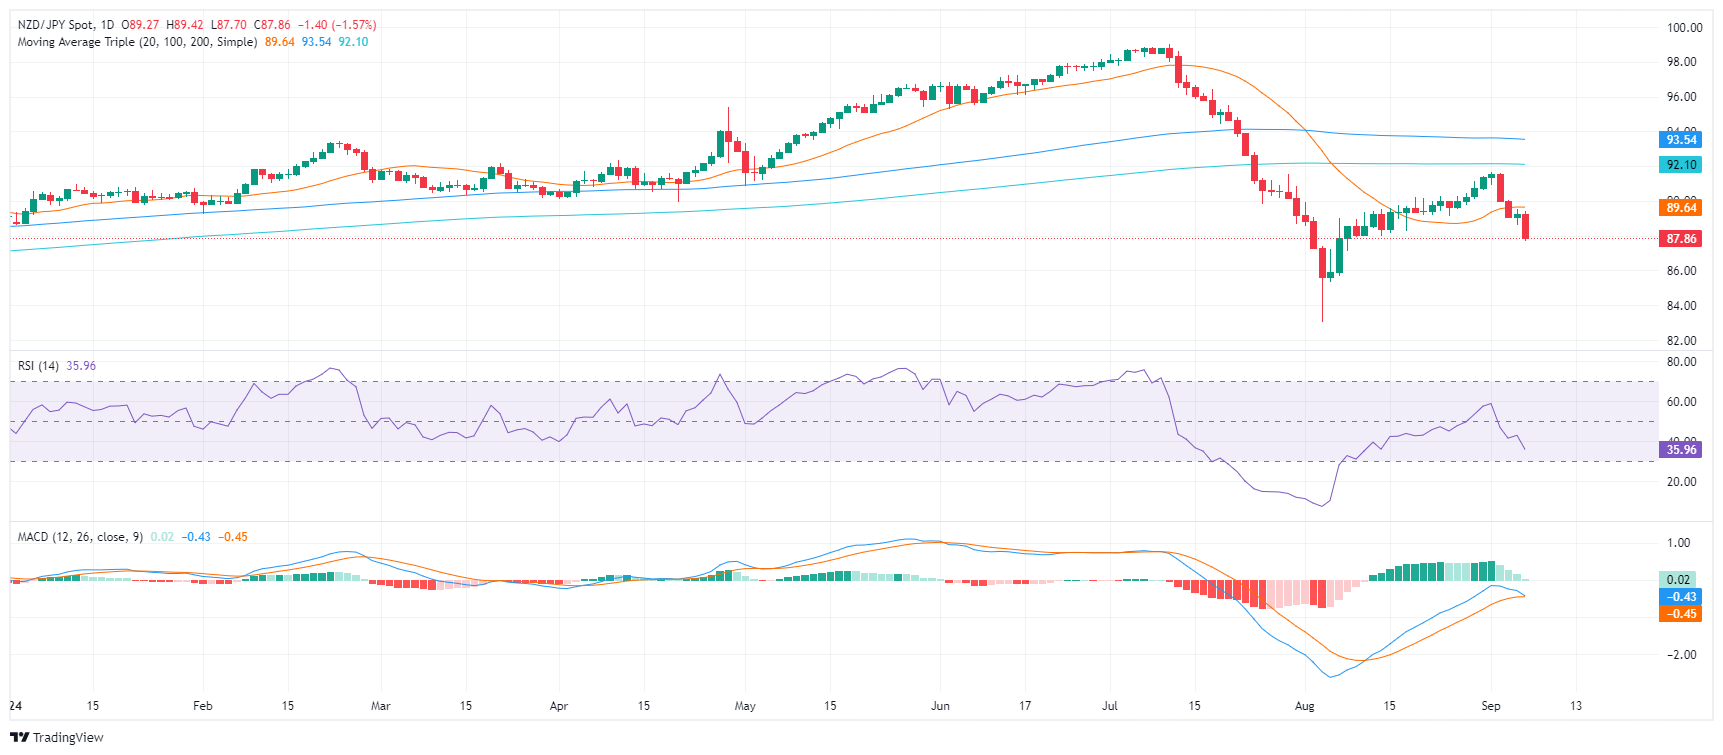
On the daily chart, the NZD/JPY pair is showing signs of sustained weakness. After having fallen below the 20-day Simple Moving Average (SMA) of 89.60, bears seem to have gained sufficient momentum to exert further downward pressure. If the selling continues, critical support levels appear at 87.50, 87.30, and 87.00.


Disclaimer: For information purposes only. Past performance is not indicative of future results.
placeholder
Natural Gas sinks to pivotal level as China’s demand slumpsNatural Gas price (XNG/USD) edges lower and sinks to $2.56 on Monday, extending its losing streak for the fifth day in a row. The move comes on the back of China cutting its Liquified Natural Gas (LNG) imports after prices rose above $3.0 in June. It
Author  FXStreet
Jul 01, 2024
Natural Gas price (XNG/USD) edges lower and sinks to $2.56 on Monday, extending its losing streak for the fifth day in a row. The move comes on the back of China cutting its Liquified Natural Gas (LNG) imports after prices rose above $3.0 in June. It
placeholder
Bitcoin Price Flashes Fractal Similar To October 2023, Here’s What Happened Last TimeCrypto analyst TradingShot recently revealed that the Bitcoin price is forming a similar fractal pattern to the one that happened in October 2023. This is bullish for the flagship crypto, considering what happened last year when the fractal pattern formed.
Author  NewsBTC
Oct 11, 2024
Crypto analyst TradingShot recently revealed that the Bitcoin price is forming a similar fractal pattern to the one that happened in October 2023. This is bullish for the flagship crypto, considering what happened last year when the fractal pattern formed.
placeholder
Bitcoin Price Forecast: BTC extends gains after third consecutive week of ETF inflowsBitcoin (BTC) extends gains, trading above $73,000 at the time of writing on Monday, following a bullish breakout from the consolidation pattern it had been trading since roughly the past six weeks.
Author  FXStreet
Mar 16, Mon
Bitcoin (BTC) extends gains, trading above $73,000 at the time of writing on Monday, following a bullish breakout from the consolidation pattern it had been trading since roughly the past six weeks.
placeholder
Gold rises on Middle East tensions; inflation fears temper rate cut bets and cap gainsGold (XAU/USD) edges higher during the Asian session on Tuesday, though it lacks follow-through and remains close to an over three-week low, touched the previous day.
Author  FXStreet
Yesterday 05: 50
Gold (XAU/USD) edges higher during the Asian session on Tuesday, though it lacks follow-through and remains close to an over three-week low, touched the previous day.
placeholder
Silver Price Forecast: XAG/USD consolidates above $79.00; bearish bias intact ahead of FedSilver (XAG/USD) lacks a firm intraday direction and oscillates in a narrow range during the Asian session on Wednesday as traders opt to wait on the sidelines ahead of the crucial FOMC rate decision.
Author  FXStreet
11 hours ago
Silver (XAG/USD) lacks a firm intraday direction and oscillates in a narrow range during the Asian session on Wednesday as traders opt to wait on the sidelines ahead of the crucial FOMC rate decision.
Related Instrument
goTop
quote