NZD/JPY Price Forecast: Bullish momentum continues, technicals signal further gains

Source Fxstreet
  • NZD/JPY's strong bullish momentum continues, with technical indicators signaling a potential shift.
  • The RSI is vertically up but remains in oversold terrain.
  • The MACD indicator is also bullish, as the histogram is turning positive.

The NZD/JPY pair has shown a strong bullish momentum this week, with Wednesday's 2% gain towards 88.00 suggesting that the bulls are waking up.

The Moving Average Convergence Divergence (MACD) indicator is also showing signs of bullishness with the historgram printing lower red bars. On the other hand, the Relative Strength Index (RSI) has moved from 10 to 30. This suggests that the bulls are in control of the market and that further gains are likely as technically the pair is oversold so the bulls have more room to go.

NZD/JPY daily chart

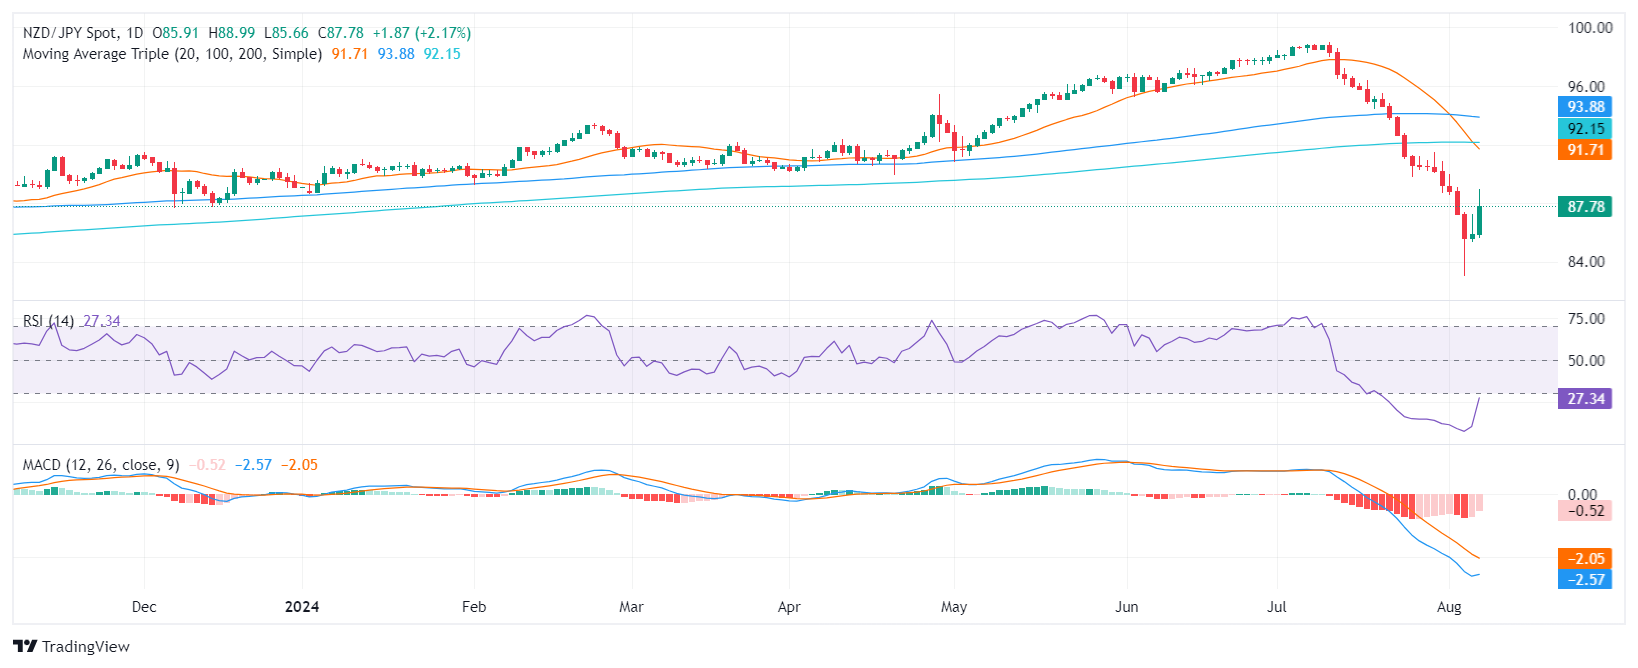
The NZD/JPY pair is consolidating above the 87.00 level, and the bulls are attempting to push the pair towards the 90.00 zone. If the bulls are successful, it could open the door to further gains towards the 91.00 zone. However, if the bears manage to push the pair below the 87.00 level, it could lead to a deeper correction to restest the 86.00 - 85.00 zone.


Disclaimer: For information purposes only. Past performance is not indicative of future results.
placeholder
What's Really Inside the AI Bubble? Decoding the Core Controversies Over Scale, Reliance and Valuation As ChatGPT nears its three-year anniversary, the AI boom has fueled a three-year U.S. equity rally. However, growing AI bubble concerns and investor fatigue now threaten to derail market
Author  TradingKey
Nov 14, Fri
As ChatGPT nears its three-year anniversary, the AI boom has fueled a three-year U.S. equity rally. However, growing AI bubble concerns and investor fatigue now threaten to derail market
placeholder
Top 3 Price Prediction: Bitcoin, Ethereum, Ripple – BTC, ETH, and XRP flash deeper downside risks as market selloff intensifiesBitcoin (BTC), Ethereum (ETH) and Ripple (XRP) trade in red on Friday after correcting more than 5%, 10% and 2%, respectively, so far this week.
Author  FXStreet
Nov 14, Fri
Bitcoin (BTC), Ethereum (ETH) and Ripple (XRP) trade in red on Friday after correcting more than 5%, 10% and 2%, respectively, so far this week.
placeholder
Gold Posts Biggest Weekly Gain in a Month as US Data Delays Fuel UncertaintyGold climbed higher on Friday, marking its strongest weekly performance in a month, as traders weighed the impact of a data backlog following the end of the US government's extended shutdown. Silver also moved upward.
Author  Mitrade
Nov 14, Fri
Gold climbed higher on Friday, marking its strongest weekly performance in a month, as traders weighed the impact of a data backlog following the end of the US government's extended shutdown. Silver also moved upward.
placeholder
WTI rises to near $60.00 on supply risks due to US sanctionsWest Texas Intermediate (WTI) Oil price gains for the second successive session, trading around $59.90, up by more than 2%, during the Asian hours on Friday. Crude Oil prices receive support from supply risks linked to upcoming United States (US) sanctions.
Author  FXStreet
Nov 14, Fri
West Texas Intermediate (WTI) Oil price gains for the second successive session, trading around $59.90, up by more than 2%, during the Asian hours on Friday. Crude Oil prices receive support from supply risks linked to upcoming United States (US) sanctions.
placeholder
Ethereum slides 5% as bears lean on $3,500 cap and put $3,150 support in focusEthereum (ETH) drops more than 5% after a failed push above $3,550, with price sliding to $3,153 and now holding below $3,350, the 100-hour SMA and a bearish trend line at $3,500; unless bulls reclaim the $3,350–$3,500 zone, the short-term bias stays bearish and a clean break under $3,150 could expose $3,050, $3,000 and even the $2,880–$2,850 support area.
Author  Mitrade
Nov 14, Fri
Ethereum (ETH) drops more than 5% after a failed push above $3,550, with price sliding to $3,153 and now holding below $3,350, the 100-hour SMA and a bearish trend line at $3,500; unless bulls reclaim the $3,350–$3,500 zone, the short-term bias stays bearish and a clean break under $3,150 could expose $3,050, $3,000 and even the $2,880–$2,850 support area.
Related Instrument
goTop
quote