AUD/JPY Price Analysis: Bears remain in control, despite Tuesday's rally

Source Fxstreet
  • The AUD/JPY bears remain in control despite Tuesday's gap-up.
  • The pair gained significant ground but faced firm resistance at 94.50.
  • The RSI and MACD indicate bearish momentum is waning.

On Tuesday's session, the AUD/JPY pair gapped up by 1.20% to 94.70, recovering some of the losses seen in the previous sessions. However, the pair seems to have entered in a consolidation period, and the bears remain in control.

The Relative Strength Index (RSI) is currently at 18, indicating an oversold condition. The Moving Average Convergence Divergence (MACD) is showing decreasing red bars, and the recovery of the RSI indicates a loss of bearish momentum.

AUD/JPY daily chart

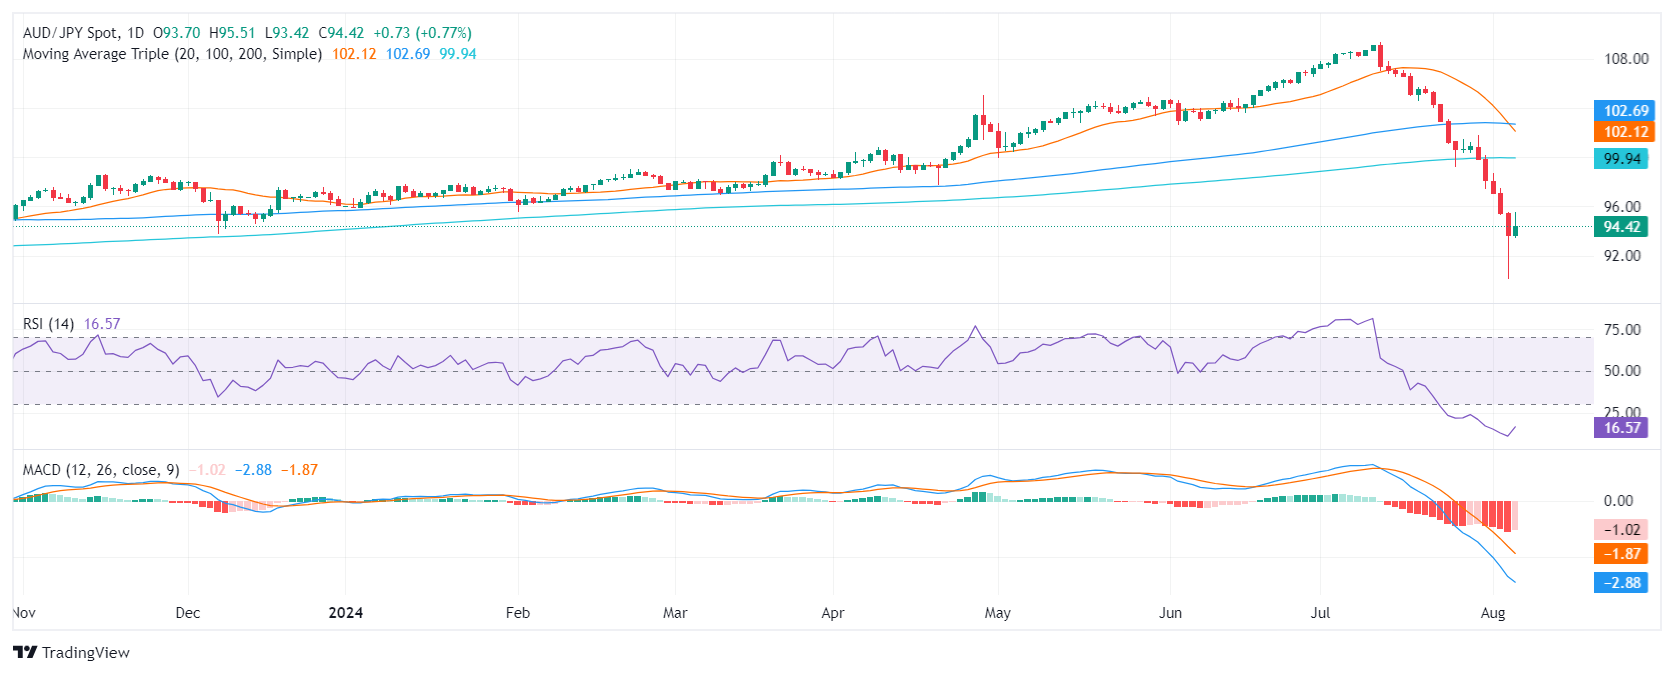
The AUD/JPY pair is currently trading below its 20,100, and 200-day Simple Moving Averages (SMA), which confirms an overall bearish outlook. A break below the 94.60 level could open the door to a further decline, with the next major support level at 94.00. On the upside, the pair faces resistance at 94.50 - 95.50. A break above might improve somewhat the negative outlook.

Disclaimer: For information purposes only. Past performance is not indicative of future results.
placeholder
Bitcoin Suffers Year’s Strongest Waterfall-Style Decline. Will It Next Drop to the $60,000 Mark?During the Asian trading session on June 4, Bitcoin continued its multi-day slump, briefly dropping below the $62,000 mark to $61,338. As of press time, Bitcoin was trading at $63,844, wi
Author  TradingKey
7 hours ago
During the Asian trading session on June 4, Bitcoin continued its multi-day slump, briefly dropping below the $62,000 mark to $61,338. As of press time, Bitcoin was trading at $63,844, wi
placeholder
Bitcoin drops below $65K amid reinforced bear market signalsBitcoin (BTC) dipped further below $65,000 on Wednesday, with onchain data from Glassnode signaling a market firmly in a bear phase. The decline has pushed prices back into a key valuation range between the Realized Price and the True Market Mean.
Author  FXStreet
16 hours ago
Bitcoin (BTC) dipped further below $65,000 on Wednesday, with onchain data from Glassnode signaling a market firmly in a bear phase. The decline has pushed prices back into a key valuation range between the Realized Price and the True Market Mean.
placeholder
Forex Today: US Dollar stays resilient ahead of key US dataHere is what you need to know on Wednesday, June 3:
Author  FXStreet
Yesterday 10: 27
Here is what you need to know on Wednesday, June 3:
placeholder
$1.5 Billion in Crypto Assets Liquidated, Bitcoin Falls Below $66,000 Mark. What Is the Reason?On June 2, Eastern Time, the cryptocurrency market suffered its most severe wave of concentrated liquidations so far this year. Bitcoin ( BTC) fell below the $70,000 psychological support
Author  TradingKey
Yesterday 06: 32
On June 2, Eastern Time, the cryptocurrency market suffered its most severe wave of concentrated liquidations so far this year. Bitcoin ( BTC) fell below the $70,000 psychological support
placeholder
WTI rises to near $93.00 as Iran launches missiles toward Kuwait, BahrainWest Texas Intermediate (WTI) gains ground for the third successive day, trading around $92.90 per barrel during the Asian hours on Wednesday.
Author  FXStreet
Yesterday 01: 24
West Texas Intermediate (WTI) gains ground for the third successive day, trading around $92.90 per barrel during the Asian hours on Wednesday.
Related Instrument
goTop
quote