


GBPUSD backslides after BoE rate cut with NFP looming ahead
- GBP/USD heads for 1.2700 after slumping to a one-month low.
- The BoE cut rates as expected, easing the GBP lower.
- US data sparked fresh fears of a recession, NFP data looms on Friday.
GBP/USD found a new hole in the floor on Thursday, declining towards the 1.2700 handle after fresh recession fears off the back of a miss in US Purchasing Managers Index (PMI) figures that mixed poorly with easing Pound Sterling flows after the Bank of England (BoE) delivered a broadly-expected quarter-point rate trim.
Forex Today: Markets’ attention shifts to US NFP
Friday’s upcoming US Nonfarm Payrolls (NFP) will be a critical print this week after the Federal Reserve (Fed) laid out the track needed in economic data to deliver a widely-anticipated rate cut in September. Investors will be hoping for a continued, but not too steep, decline in new jobs additions in July. US NFP is expected to ease down to 175K net new hirings for the month compared to the previous month’s 206K.
US Initial Jobless Claims for the week ended July 26 rose to 249K from the previous week’s 235K, lurching past the forecast uptick to 236K. July’s US ISM Manufacturing Purchasing Managers Index (PMI) tumbled to an eight-month low of 46.8 compared to the previous 48.5 and entirely reversing the forecast move up to 48.8.
ISM Manufacturing Prices Paid in July accelerated to 52.9 versus the previous 52.1, missing the forecast decline to 48.8 as input prices for manufacturers continue to drift higher than markets anticipated even as activity declines.
The markets are currently facing a delicate balancing act, with economic downturns increasing expectations for a rate cut from the Fed. The CME's FedWatch Tool shows that traders are pricing in a 100% chance of at least a quarter-point rate cut on September 18, with a one-in-five chance of a 50 basis points cut. However, if the downturn becomes too severe, it could negatively impact market sentiment, rendering any rate cuts from the Fed irrelevant. This puts investors in a challenging position, as they are hoping for rate cuts based on soft data, but not wishing for a scenario where the US economy experiences a hard landing.
Economic Indicator
Nonfarm Payrolls
The Nonfarm Payrolls release presents the number of new jobs created in the US during the previous month in all non-agricultural businesses; it is released by the US Bureau of Labor Statistics (BLS). The monthly changes in payrolls can be extremely volatile. The number is also subject to strong reviews, which can also trigger volatility in the Forex board. Generally speaking, a high reading is seen as bullish for the US Dollar (USD), while a low reading is seen as bearish, although previous months' reviews and the Unemployment Rate are as relevant as the headline figure. The market's reaction, therefore, depends on how the market assesses all the data contained in the BLS report as a whole.
Read more.Next release: Fri Aug 02, 2024 12:30
Frequency: Monthly
Consensus: 175K
Previous: 206K
Source: US Bureau of Labor Statistics
America’s monthly jobs report is considered the most important economic indicator for forex traders. Released on the first Friday following the reported month, the change in the number of positions is closely correlated with the overall performance of the economy and is monitored by policymakers. Full employment is one of the Federal Reserve’s mandates and it considers developments in the labor market when setting its policies, thus impacting currencies. Despite several leading indicators shaping estimates, Nonfarm Payrolls tend to surprise markets and trigger substantial volatility. Actual figures beating the consensus tend to be USD bullish.
GBP/USD technical outlook
Thursday’s 1% decline in the Cable dragged bids into the low end, smashing through the 50-day Exponential Moving Average (EMA) at 1.2789 as price action turns notably bearish. The pair is still trading above the 200-day EMA at 1.2667, but bidders are running out of breathing room as short pressure continues to build.
GBP/USD is down -2.43% and counting from a recent 12-month high of 1.3045 hit in recent weeks. The last chance for a bullish recovery will be at the last swing low into 1.2600.
GBP/USD daily chart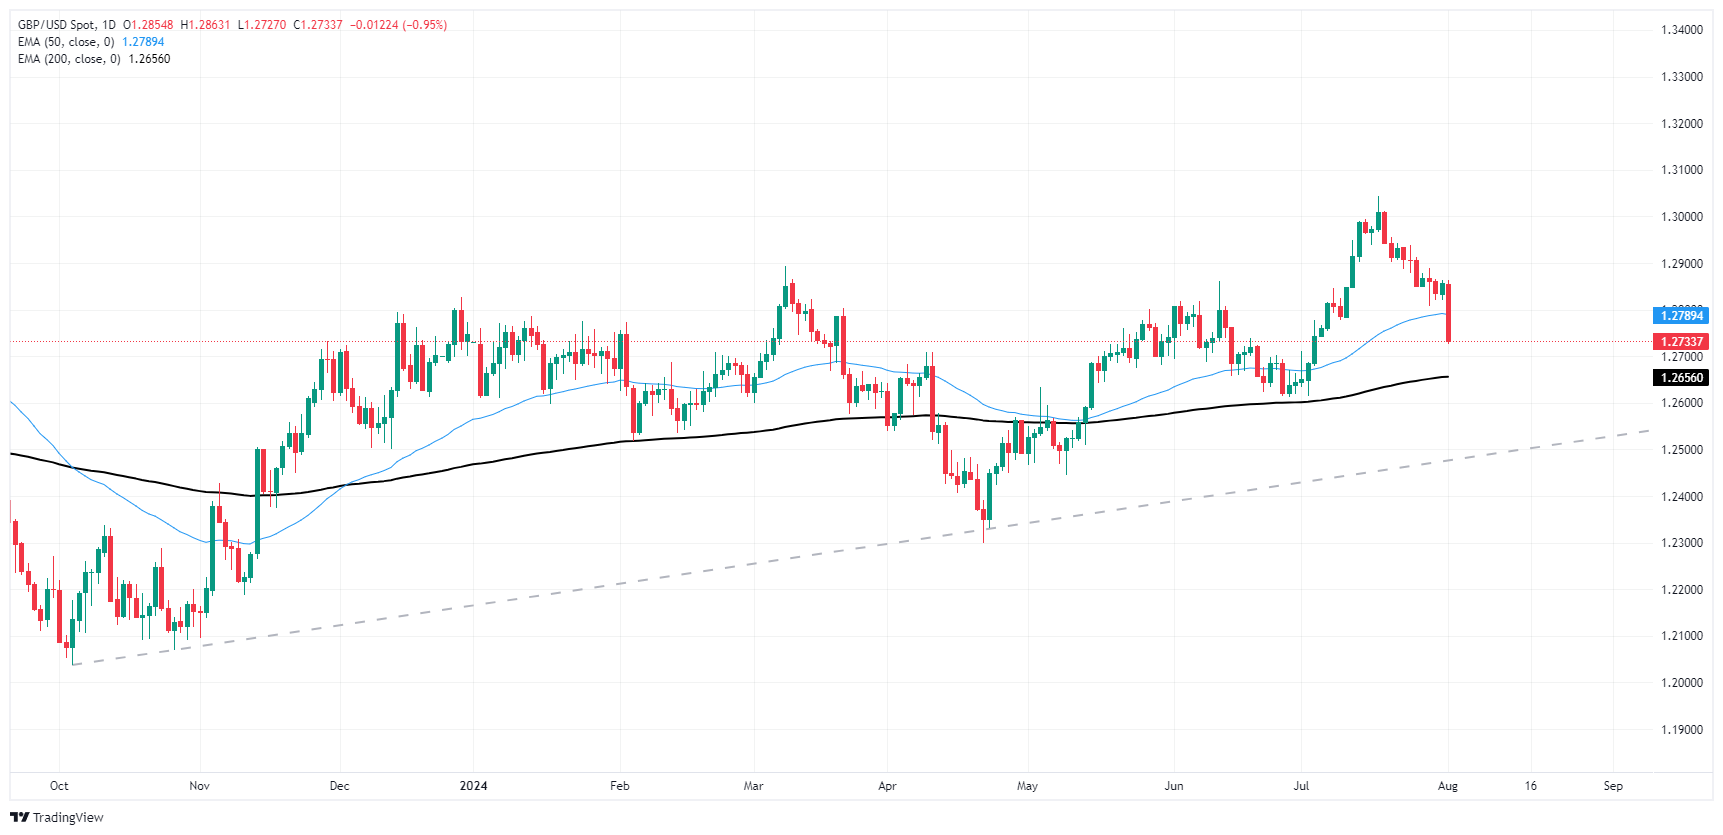
Pound Sterling FAQs
The Pound Sterling (GBP) is the oldest currency in the world (886 AD) and the official currency of the United Kingdom. It is the fourth most traded unit for foreign exchange (FX) in the world, accounting for 12% of all transactions, averaging $630 billion a day, according to 2022 data. Its key trading pairs are GBP/USD, aka ‘Cable’, which accounts for 11% of FX, GBP/JPY, or the ‘Dragon’ as it is known by traders (3%), and EUR/GBP (2%). The Pound Sterling is issued by the Bank of England (BoE).
The single most important factor influencing the value of the Pound Sterling is monetary policy decided by the Bank of England. The BoE bases its decisions on whether it has achieved its primary goal of “price stability” – a steady inflation rate of around 2%. Its primary tool for achieving this is the adjustment of interest rates. When inflation is too high, the BoE will try to rein it in by raising interest rates, making it more expensive for people and businesses to access credit. This is generally positive for GBP, as higher interest rates make the UK a more attractive place for global investors to park their money. When inflation falls too low it is a sign economic growth is slowing. In this scenario, the BoE will consider lowering interest rates to cheapen credit so businesses will borrow more to invest in growth-generating projects.
Data releases gauge the health of the economy and can impact the value of the Pound Sterling. Indicators such as GDP, Manufacturing and Services PMIs, and employment can all influence the direction of the GBP. A strong economy is good for Sterling. Not only does it attract more foreign investment but it may encourage the BoE to put up interest rates, which will directly strengthen GBP. Otherwise, if economic data is weak, the Pound Sterling is likely to fall.
Another significant data release for the Pound Sterling is the Trade Balance. This indicator measures the difference between what a country earns from its exports and what it spends on imports over a given period. If a country produces highly sought-after exports, its currency will benefit purely from the extra demand created from foreign buyers seeking to purchase these goods. Therefore, a positive net Trade Balance strengthens a currency and vice versa for a negative balance.
Recommended Articles


