

GBP/USD Price Analysis: Dips on strong US data approach 1.2800
- GBP/USD declines from daily high of 1.2866 amid strong US labor market data.
- Technical outlook shows bearish momentum, with key support at 1.2781 (50-DMA).
- Potential further declines to 1.2682 (100-DMA) if 1.2800 and 1.2739 support levels are breached.
The Pound Sterling dropped early during the North American session after economic data from the United States (US) came stronger than expected, highlighting a modestly tight labor market. Therefore, the GBP/USD edges down some 0.20% and trades at 1.2827 after hitting a daily high of 1.2866.
GBP/USD Price Analysis: Technical outlook
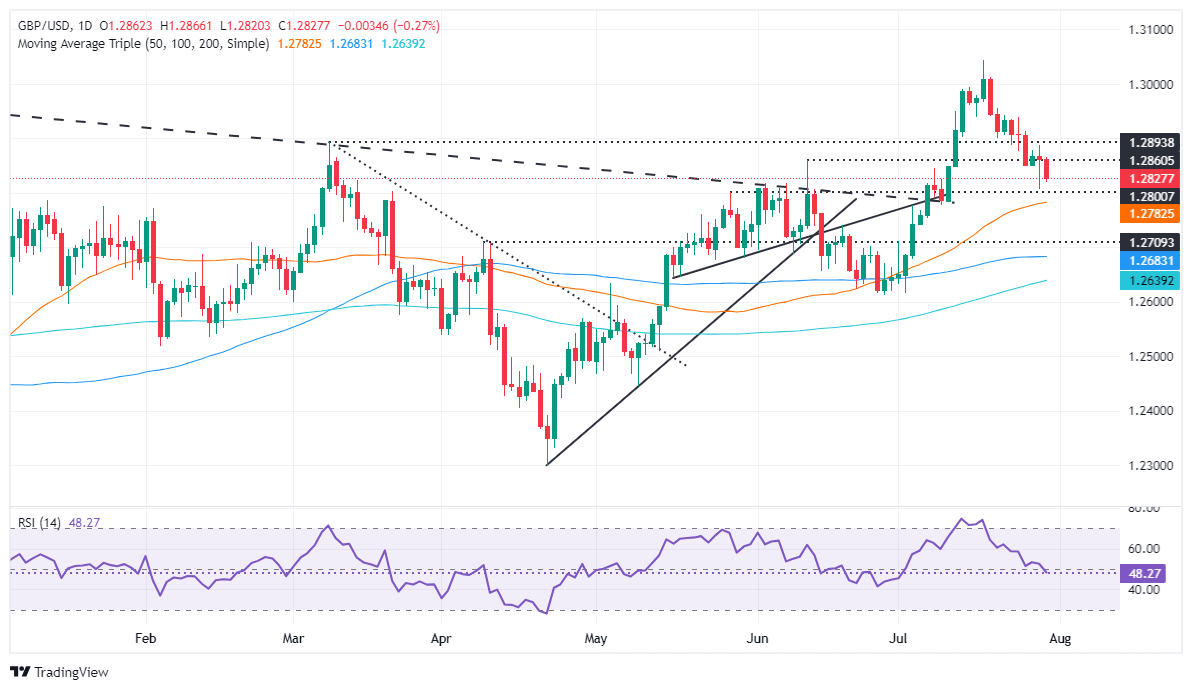
The GPB/USD extends its losses after peaking at a year-to-date (YTD) high of 1.3043, with buyers unable to fight back and lift the exchange rate above the previous cycle high seen on March 8 at 1.2893. Once the pair cleared the latter, the losses continued to pile up, with market participants eyeing a test of the 50-day moving average (DMA) at 1.2781.
The Relative Strength Index (RSI) hints that momentum favors sellers. Hence, the GBP/USD path of least resistance is tilted to the downside.
If GBP/USD drops beneath 1.2800, the next stop would be the abovementioned 50-DMA, followed by the June 19 high at 1.2739. If those levels are surpassed, the next stop would be beneath 1.2700 at the 100-DMA at 1.2682, followed by the 200-DMA at 1.2633.
For a bullish correction, the GBP/USD must clear the July 29 high of 1.2888 and the July 24 peak of 1.2937 so that buyers can challenge the YTD high.
GBP/USD Price Action – Daily Chart
Pound Sterling FAQs
The Pound Sterling (GBP) is the oldest currency in the world (886 AD) and the official currency of the United Kingdom. It is the fourth most traded unit for foreign exchange (FX) in the world, accounting for 12% of all transactions, averaging $630 billion a day, according to 2022 data. Its key trading pairs are GBP/USD, aka ‘Cable’, which accounts for 11% of FX, GBP/JPY, or the ‘Dragon’ as it is known by traders (3%), and EUR/GBP (2%). The Pound Sterling is issued by the Bank of England (BoE).
The single most important factor influencing the value of the Pound Sterling is monetary policy decided by the Bank of England. The BoE bases its decisions on whether it has achieved its primary goal of “price stability” – a steady inflation rate of around 2%. Its primary tool for achieving this is the adjustment of interest rates. When inflation is too high, the BoE will try to rein it in by raising interest rates, making it more expensive for people and businesses to access credit. This is generally positive for GBP, as higher interest rates make the UK a more attractive place for global investors to park their money. When inflation falls too low it is a sign economic growth is slowing. In this scenario, the BoE will consider lowering interest rates to cheapen credit so businesses will borrow more to invest in growth-generating projects.
Data releases gauge the health of the economy and can impact the value of the Pound Sterling. Indicators such as GDP, Manufacturing and Services PMIs, and employment can all influence the direction of the GBP. A strong economy is good for Sterling. Not only does it attract more foreign investment but it may encourage the BoE to put up interest rates, which will directly strengthen GBP. Otherwise, if economic data is weak, the Pound Sterling is likely to fall.
Another significant data release for the Pound Sterling is the Trade Balance. This indicator measures the difference between what a country earns from its exports and what it spends on imports over a given period. If a country produces highly sought-after exports, its currency will benefit purely from the extra demand created from foreign buyers seeking to purchase these goods. Therefore, a positive net Trade Balance strengthens a currency and vice versa for a negative balance.
Recommended Articles


