NZD/USD Price Analysis: Bears take a breather, yet maintain a clear domination

Source Fxstreet
  • NZD/USD slightly rebounds, hovering near the 0.5900 mark, but remains under a clear bearish influence.
  • The pair lost more than 4% in July, underscoring a strong bearish outlook.
  • The 0.5850 area is the last barrier against the sellers.

In Friday's session, the NZD/USD took a slight break from its continual downward trajectory, mildly rebounding to 0.5890. This brief respite comes after a six-day losing streak that led to a significant bearish turnaround for the currency pair. The overall picture still reveals a strongly bearish influence, given the pair lost over 4% in July, and the bearish crossover of the 20-day Simple Moving Average (SMA) at 0.6050 with the 100-day SMA, which might just inspire the bears further.

The daily technical indicators continue to signal a bearish trend. The Relative Strength Index (RSI) stands at 24, nestled firmly within oversold territory, which indicates intense selling pressure. Additionally, the Moving Average Convergence Divergence (MACD) with its flat red bars lends further support to a bearish outlook. As the RSI descends further into the oversold region, there may be a possible corrective momentum on the horizon.

NZD/USD daily chart
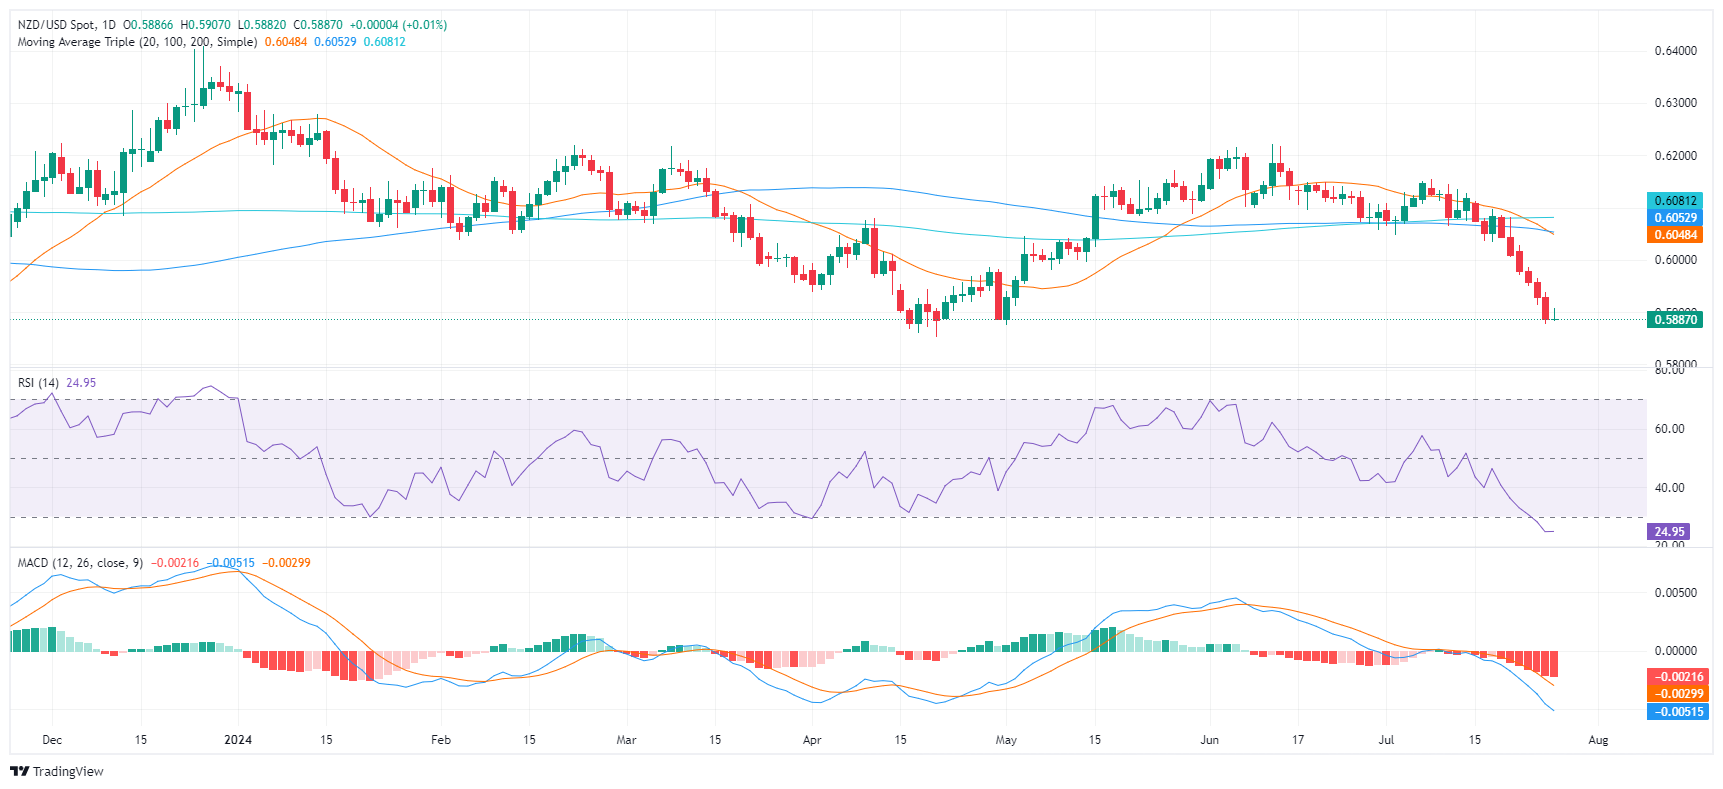
From a daily chart perspective, strong support is noticed at the 0.5880 level and slightly below that at May lows around 0.5850. On the flip side, resistance can now be spotted at the former support level of 0.6000, followed by 0.6050.

Disclaimer: For information purposes only. Past performance is not indicative of future results.
placeholder
Bitcoin slides deeper into red as bears lean on $96,600 wall and eye $90,000Bitcoin extends its decline after failing to reclaim $96,500, trading below $95,000, the 100-hour SMA and a bearish trend line near $96,600; unless bulls can force a decisive close back above $96,600–$97,200, the short-term path of least resistance stays lower, with $92,500, $90,000 and the main $88,500 support zone in focus.
Author  Mitrade
Nov 17, Mon
Bitcoin extends its decline after failing to reclaim $96,500, trading below $95,000, the 100-hour SMA and a bearish trend line near $96,600; unless bulls can force a decisive close back above $96,600–$97,200, the short-term path of least resistance stays lower, with $92,500, $90,000 and the main $88,500 support zone in focus.
placeholder
Gold Price Forecast: XAU/USD declines below $4,050 on USD strength and hawkish Fed comments Gold price (XAU/USD) extends the decline to around $4,030 during the early Asian session on Tuesday. The precious metal edges lower as traders dialed back expectations of a US interest rate cut next month.
Author  FXStreet
Yesterday 01: 23
Gold price (XAU/USD) extends the decline to around $4,030 during the early Asian session on Tuesday. The precious metal edges lower as traders dialed back expectations of a US interest rate cut next month.
placeholder
Ethereum Edges Toward Long-Term Holders’ Cost Basis, Now Only 8% Above Key Accumulation LevelEthereum is trading near $3,150 and just 8% above a key $2,895 long-term holders’ cost basis, with on-chain flows, macro uncertainty and support around $3,000–$2,800 all shaping what comes next for ETH.
Author  Mitrade
Yesterday 02: 28
Ethereum is trading near $3,150 and just 8% above a key $2,895 long-term holders’ cost basis, with on-chain flows, macro uncertainty and support around $3,000–$2,800 all shaping what comes next for ETH.
placeholder
Ethereum Dips Below $3,000: Is the Bull Market at an End?Ethereum's price plunged below $3,000 for the first time in four months, marking growing concerns of a potential end to the bull market.
Author  Mitrade
Yesterday 03: 34
Ethereum's price plunged below $3,000 for the first time in four months, marking growing concerns of a potential end to the bull market.
placeholder
Top 3 Price Prediction: Bitcoin, Ethereum, Ripple – BTC, ETH and XRP Look for a Foothold After a Sharp ShakeoutBitcoin trades near $92,600 after a dip below $90,000, while Ethereum around $3,118 and XRP near $2.21–$2.23 sit on key support zones, as BTC, ETH and XRP all try to turn a sharp correction into a tradable rebound rather than a deeper slide.
Author  Mitrade
3 hours ago
Bitcoin trades near $92,600 after a dip below $90,000, while Ethereum around $3,118 and XRP near $2.21–$2.23 sit on key support zones, as BTC, ETH and XRP all try to turn a sharp correction into a tradable rebound rather than a deeper slide.
goTop
quote