

EUR/GBP floats higher as BoE rate cut bets weigh down Pound Sterling
- EUR/GBP rose back into familiar highs near 0.8430 on Thursday.
- Market action is giving the Euro a leg up against the Pound Sterling.
- Investors are adding into BoE rate cut bets, softening the GBP.
EUR/GBP is back into a near-term high around 0.8430 as markets firm up bets of a Bank of England (BoE) rate cut next week. Money markets now see slightly more than 50% odds of at least a quarter-point rate trim when the BoE gathers to deliver its latest rate call one week from now on August 1.
Plenty of Euro-centric action still remains in the charts ahead of the BoE’s latest possible rate adjustment; preliminary Pan-European Gross Domestic Product (GDP) figures for Q2 are slated for next Tuesday and expected to backslide to 0.2% from the previous 0.3% QoQ. Next Wednesday sees more pan-EU data with July’s Harmonized Index of Consumer Prices (HICP). EU-wide Core HICP inflation last printed at 2.9% YoY in June, still well above the European Central Bank’s (ECB) 2.0% target range.
EUR/GBP technical outlook
EUR/GBP is on pace to put in one of its best single-day performances of 2024 on Thursday, in the green by around one-third of one percent, but long-term traders will note that still leaves the pair at the low end of a very deep hole. EUR/GBP fell -3.28% peak-to-trough in 2024, falling to an almost two-year low near 0.8383.
Euro bidders will be looking for a three-stage recovery off the back of dual Euro-area economic data showings and a rate cut from the BoE next week, but EUR/GBP remains buried well below the 200-day Exponential Moving Average (EMA) at 0.8545.
EUR/GBP hourly chart
EUR/GBP daily chart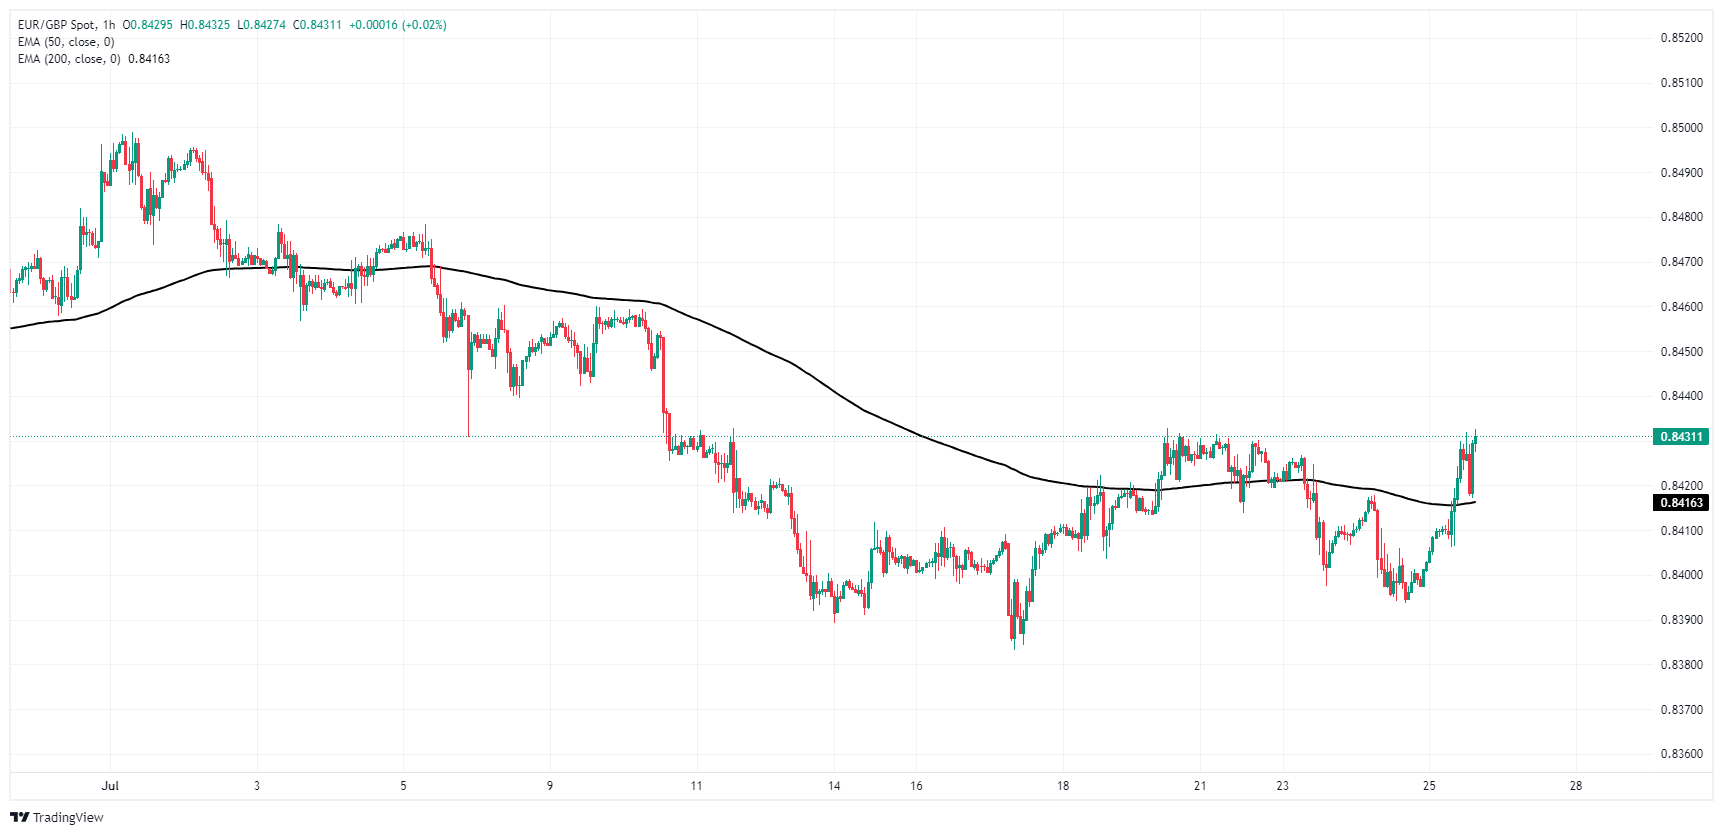
BoE FAQs
The Bank of England (BoE) decides monetary policy for the United Kingdom. Its primary goal is to achieve ‘price stability’, or a steady inflation rate of 2%. Its tool for achieving this is via the adjustment of base lending rates. The BoE sets the rate at which it lends to commercial banks and banks lend to each other, determining the level of interest rates in the economy overall. This also impacts the value of the Pound Sterling (GBP).
When inflation is above the Bank of England’s target it responds by raising interest rates, making it more expensive for people and businesses to access credit. This is positive for the Pound Sterling because higher interest rates make the UK a more attractive place for global investors to park their money. When inflation falls below target, it is a sign economic growth is slowing, and the BoE will consider lowering interest rates to cheapen credit in the hope businesses will borrow to invest in growth-generating projects – a negative for the Pound Sterling.
In extreme situations, the Bank of England can enact a policy called Quantitative Easing (QE). QE is the process by which the BoE substantially increases the flow of credit in a stuck financial system. QE is a last resort policy when lowering interest rates will not achieve the necessary result. The process of QE involves the BoE printing money to buy assets – usually government or AAA-rated corporate bonds – from banks and other financial institutions. QE usually results in a weaker Pound Sterling.
Quantitative tightening (QT) is the reverse of QE, enacted when the economy is strengthening and inflation starts rising. Whilst in QE the Bank of England (BoE) purchases government and corporate bonds from financial institutions to encourage them to lend; in QT, the BoE stops buying more bonds, and stops reinvesting the principal maturing on the bonds it already holds. It is usually positive for the Pound Sterling.
Recommended Articles


