

USD/JPY Price Analysis: Plunges below Kumo and 154.00, turns bearish

Source Fxstreet
  • USD/JPY falls more than 1.08%, breaking through key supports.
  • Strong seller momentum; RSI suggests nearing oversold conditions.
  • Key support at 151.86; resistance at 156.00 required for buyer control and Ichimoku Cloud breach.

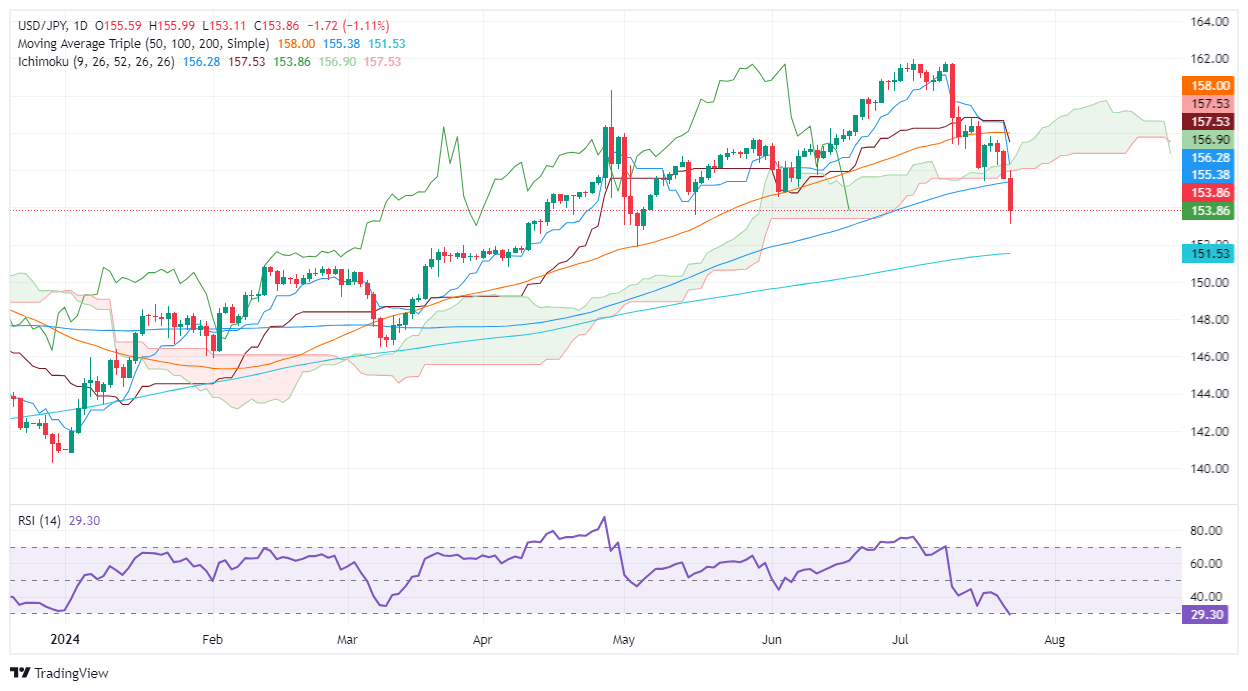
The USD/JPY continues to fall off the cliff, dropping more than 1%, and is now more than 2% down in the week, as the pair breached key support levels. This is paving the way for further losses, and the pair trades at 153.11, down 1.08% on Wednesday.

USD/JPY Price Analysis: Technical outlook

The USD/JPY pair turned bearish after decisively breaching the Ichimoku Cloud (Kumo), opening the door to test lower prices. Momentum favors sellers, as shown by the Relative Strength Index (RSI), and it could turn oversold if the pair extends its losses toward the next support area.

USD/JPY's first support level would be the May 3 low at 151.86. Once surpassed, the pair could aim towards the October 21, 2022, peak, which turned support at 151.94.

Conversely, if USD/JPY buyers would like to regain control, they must reclaim the 156.00 figure so that they could lift prices above the Kumo.

USD/JPY Price Action – Daily Chart
Japanese Yen FAQs

The Japanese Yen (JPY) is one of the world’s most traded currencies. Its value is broadly determined by the performance of the Japanese economy, but more specifically by the Bank of Japan’s policy, the differential between Japanese and US bond yields, or risk sentiment among traders, among other factors.

One of the Bank of Japan’s mandates is currency control, so its moves are key for the Yen. The BoJ has directly intervened in currency markets sometimes, generally to lower the value of the Yen, although it refrains from doing it often due to political concerns of its main trading partners. The current BoJ ultra-loose monetary policy, based on massive stimulus to the economy, has caused the Yen to depreciate against its main currency peers. This process has exacerbated more recently due to an increasing policy divergence between the Bank of Japan and other main central banks, which have opted to increase interest rates sharply to fight decades-high levels of inflation.

The BoJ’s stance of sticking to ultra-loose monetary policy has led to a widening policy divergence with other central banks, particularly with the US Federal Reserve. This supports a widening of the differential between the 10-year US and Japanese bonds, which favors the US Dollar against the Japanese Yen.

The Japanese Yen is often seen as a safe-haven investment. This means that in times of market stress, investors are more likely to put their money in the Japanese currency due to its supposed reliability and stability. Turbulent times are likely to strengthen the Yen’s value against other currencies seen as more risky to invest in.


Disclaimer: For information purposes only. Past performance is not indicative of future results.
placeholder
Gold Price Forecast: PPI and Oil Prices Fuel Inflation Concerns, Can CPI Change Gold's Direction?As of the Asian session on September 11, gold prices (XAUUSD) remained in weak consolidation today after dropping sharply to near $4,300 on Thursday, with the latest price trading around
Author  TradingKey
Yesterday 09: 43
As of the Asian session on September 11, gold prices (XAUUSD) remained in weak consolidation today after dropping sharply to near $4,300 on Thursday, with the latest price trading around
placeholder
US August CPI lands tonight: after a 5.4% PPI shock, will the Fed hike on September 16?US August PPI came in at 5.4% year-on-year, above the 5.3% consensus, with core PPI at 4.6%. Traders have pushed the odds of a 25bp Fed hike on September 15-16 to around 70%. Tonight's CPI is the last major inflation print before the decision — here is the full calendar, the consensus numbers, and what a hot versus cool reading would mean for the dollar, yields, gold and stocks.
Author  Irene Q.
Yesterday 07: 26
US August PPI came in at 5.4% year-on-year, above the 5.3% consensus, with core PPI at 4.6%. Traders have pushed the odds of a 25bp Fed hike on September 15-16 to around 70%. Tonight's CPI is the last major inflation print before the decision — here is the full calendar, the consensus numbers, and what a hot versus cool reading would mean for the dollar, yields, gold and stocks.
placeholder
US-Iran Conflict Drives Oil Surge as WTI Tops $100 and Brent Nears $110International oil prices continued to advance rapidly this week. On Thursday Eastern Time, WTI crude (USOIL) broke through the $100/barrel mark, closing at $103.94, up 7.51%; Brent crude
Author  TradingKey
Yesterday 02: 08
International oil prices continued to advance rapidly this week. On Thursday Eastern Time, WTI crude (USOIL) broke through the $100/barrel mark, closing at $103.94, up 7.51%; Brent crude
placeholder
TradingKey Daily Market Briefing: WTI Oil Tops $100, US Stocks Fall for 4th Day, Apple Bucks Trend, CPI AheadTracking Market TrendsTradingKey - On September 10 Eastern Time, the three major US stock indices fell for the fourth consecutive trading day. US August PPI showed upstream price pressures continued t
Author  TradingKey
Yesterday 01: 24
Tracking Market TrendsTradingKey - On September 10 Eastern Time, the three major US stock indices fell for the fourth consecutive trading day. US August PPI showed upstream price pressures continued t
placeholder
US August CPI Preview: Will Inflation Reaccelerate? US Stocks, Dollar and Gold Face Key Test On Friday, September 11 (ET), the U.S. Bureau of Labor Statistics will release the Consumer Price Index (CPI) for August, the final major inflation report before the Federal Reserve's Sep
Author  TradingKey
Sep 10, Thu
On Friday, September 11 (ET), the U.S. Bureau of Labor Statistics will release the Consumer Price Index (CPI) for August, the final major inflation report before the Federal Reserve's Sep
Related Instrument
goTop
quote