AUD/JPY Price Analysis: Downward pressures resume, pair closes its weakest week since April

Source Fxstreet
  • AUD/JPY resumes decline, falling to 105.25, marking one of the lowest levels in over a month.
  • The recovery experienced on Thursday was short-lived as selling pressures resumed, augmenting the prevalent negative outlook.

In Friday's session, the AUD/JPY pair has resumed its downtrend, declining by 0.20% to reach 105.25. The resumption of this bearish trend suggests that the rebound registered previously on Thursday may have been more corrective rather than indicative of a trend reversal. This sustains the dominance of the bears and reinforces the existing negative outlook as the pair will close a 1.60% weekly loss.

The daily Relative Strength Index (RSI) for AUD/JPY currently stands at 42, slightly below Thursday's value, suggesting a continuation of the negative momentum. The similar pattern in the Moving Average Convergence Divergence (MACD) that continues to print rising red bars, suggests a continuation of the selling activity, despite the minor rebound seen previously.

AUD/JPY daily chart

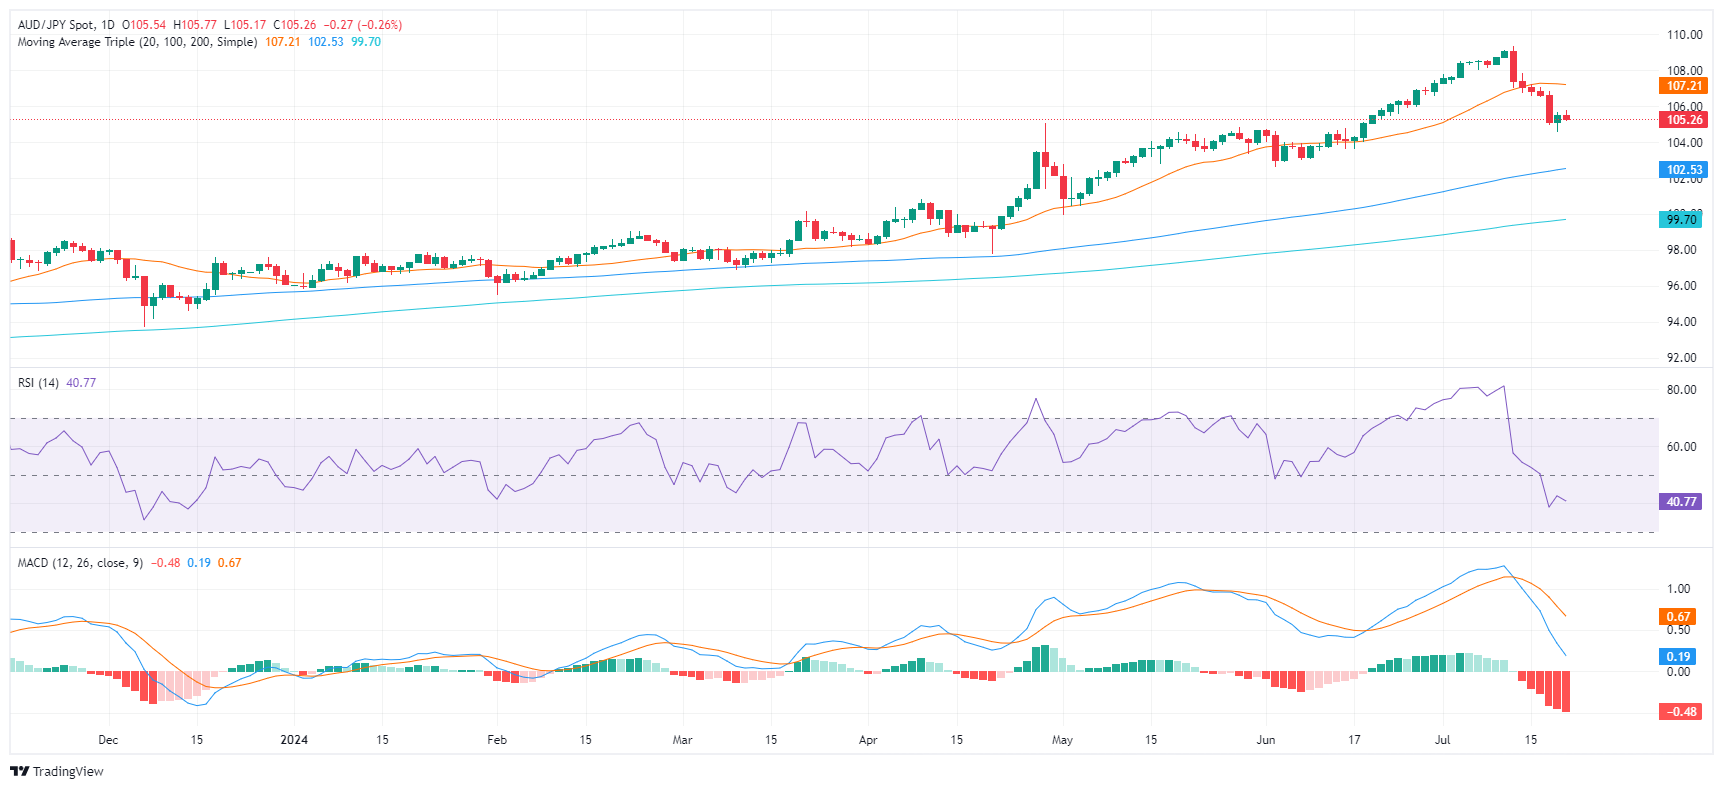
On a broader perspective, the AUD/JPY's short-term bearish trajectory seems to persist, with its price remaining below the 20-day Simple Moving Average (SMA). Looking ahead, immediate support levels appear to have formed around the 105.00 mark, which the buying pressure needs to maintain to fend off a deeper correction. To moderate further potential losses, bulls must aim for the recovery of the 106.00, and subsequently, the 106.50 mark.

Disclaimer: For information purposes only. Past performance is not indicative of future results.
placeholder
Bitcoin Suffers Year’s Strongest Waterfall-Style Decline. Will It Next Drop to the $60,000 Mark?During the Asian trading session on June 4, Bitcoin continued its multi-day slump, briefly dropping below the $62,000 mark to $61,338. As of press time, Bitcoin was trading at $63,844, wi
Author  TradingKey
8 hours ago
During the Asian trading session on June 4, Bitcoin continued its multi-day slump, briefly dropping below the $62,000 mark to $61,338. As of press time, Bitcoin was trading at $63,844, wi
placeholder
Bitcoin drops below $65K amid reinforced bear market signalsBitcoin (BTC) dipped further below $65,000 on Wednesday, with onchain data from Glassnode signaling a market firmly in a bear phase. The decline has pushed prices back into a key valuation range between the Realized Price and the True Market Mean.
Author  FXStreet
16 hours ago
Bitcoin (BTC) dipped further below $65,000 on Wednesday, with onchain data from Glassnode signaling a market firmly in a bear phase. The decline has pushed prices back into a key valuation range between the Realized Price and the True Market Mean.
placeholder
Forex Today: US Dollar stays resilient ahead of key US dataHere is what you need to know on Wednesday, June 3:
Author  FXStreet
Yesterday 10: 27
Here is what you need to know on Wednesday, June 3:
placeholder
$1.5 Billion in Crypto Assets Liquidated, Bitcoin Falls Below $66,000 Mark. What Is the Reason?On June 2, Eastern Time, the cryptocurrency market suffered its most severe wave of concentrated liquidations so far this year. Bitcoin ( BTC) fell below the $70,000 psychological support
Author  TradingKey
Yesterday 06: 32
On June 2, Eastern Time, the cryptocurrency market suffered its most severe wave of concentrated liquidations so far this year. Bitcoin ( BTC) fell below the $70,000 psychological support
placeholder
WTI rises to near $93.00 as Iran launches missiles toward Kuwait, BahrainWest Texas Intermediate (WTI) gains ground for the third successive day, trading around $92.90 per barrel during the Asian hours on Wednesday.
Author  FXStreet
Yesterday 01: 24
West Texas Intermediate (WTI) gains ground for the third successive day, trading around $92.90 per barrel during the Asian hours on Wednesday.
Related Instrument
goTop
quote