NZD/USD Price Analysis: Breach of 20-day SMA support opens door to further declines

Source Fxstreet
  • NZD/USD faced heav losses, breaching the previously held 20-day SMA support, now resistance.
  • The technical outlook transitions towards a bearish sentiment, following Wednesday's sharp decline.
  • Bears broke the 20-day SMA and are eyeing the strong support formed by the convergence of the 100 and 200-day SMAs near 0.6070.

On Wednesday, the NZD/USD dropped, losing more than 0.70% to 0.6080, obliterating its support at the 20-day Simple Moving Average (SMA), which was regained last week and tainted the outlook with red.

As for the daily technical indicators, the Relative Strength Index (RSI) is currently at 43, showing a downward trajectory, indicating a considerable decrease in buying momentum compared to Tuesday's close at 52. The Moving Average Convergence Divergence (MACD) printed a fresh red bar, suggesting an increasing bearish momentum.

NZD/USD daily chart

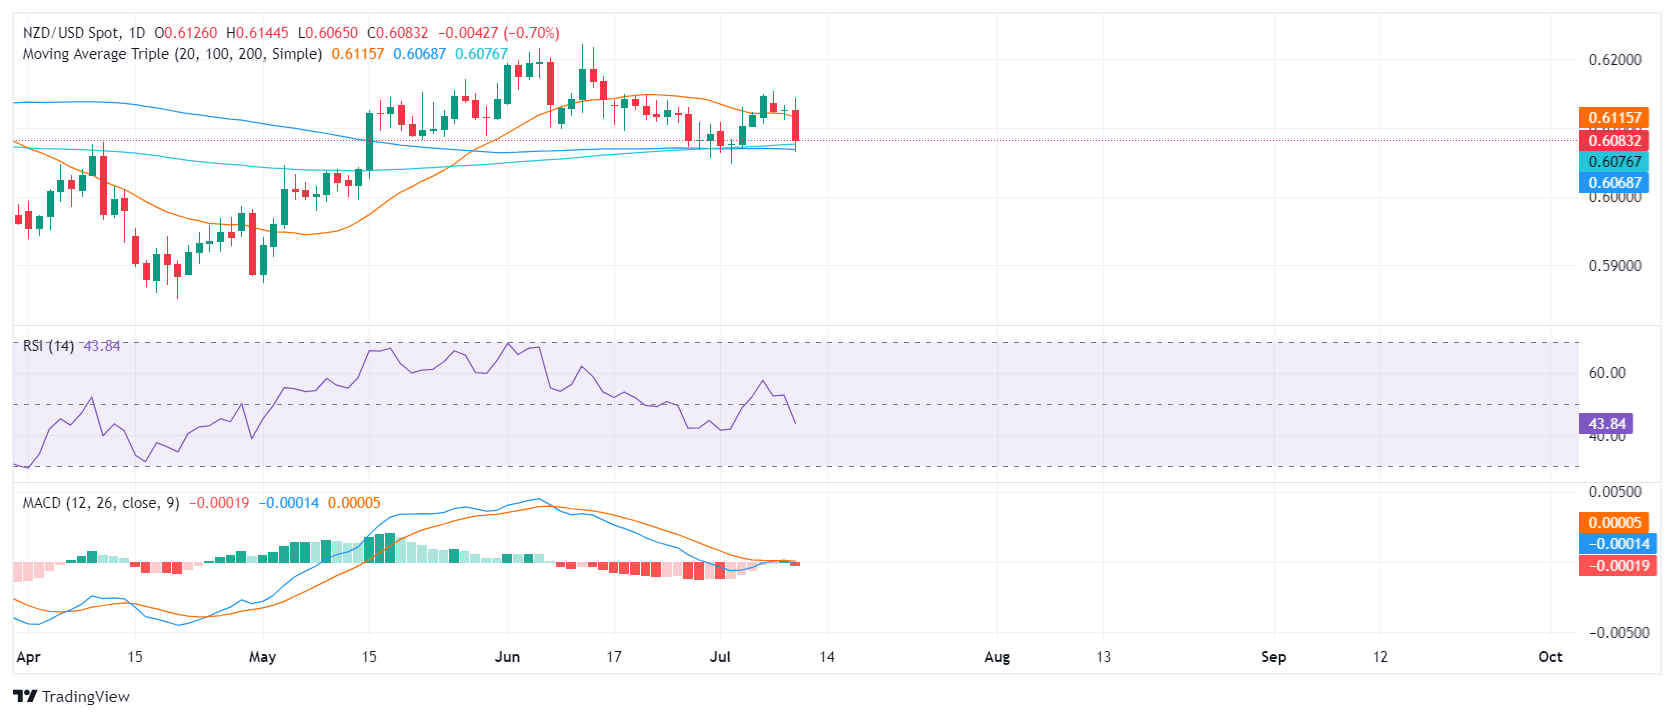
In terms of resistance for bulls to recover, the immediate challenge lies at the 0.6115 level (20-day SMA) now turned into resistance, and then at 0.6150. A decisive close above these levels will be crucial to negate the recent bearish momentum and might assist bulls in making a fresh attempt to reclaim control.

On the downside, immediate support is near the crucial convergence of 100 and 200-day SMAs at 0.6070. A conclusive break below this level could affirm the negative outlook, triggering a deeper corrective slide towards 0.6050 and then the 0.6030 support levels.

Disclaimer: For information purposes only. Past performance is not indicative of future results.
placeholder
Is the Crypto Rally Dead? Why Bernstein Still Predicts a $150K Bitcoin Peak Despite Waller’s WarningsFed Governor Waller claims the crypto craze has faded, while Bernstein backs Bitcoin to reach $150,000 this year.On Tuesday (February 10), the cryptocurrency market remained sluggish; wit
Author  TradingKey
7 hours ago
Fed Governor Waller claims the crypto craze has faded, while Bernstein backs Bitcoin to reach $150,000 this year.On Tuesday (February 10), the cryptocurrency market remained sluggish; wit
placeholder
Gold Price Forecast: XAU/USD falls below $5,050 as traders await US jobs data Gold price (XAU/USD) attracts some sellers near $5,035 during the early Asian session on Tuesday. The precious metal edges lower amid improved risk sentiment and some profit-taking. Traders brace for key US economic data later this week, including delayed employment and inflation reports. 
Author  FXStreet
16 hours ago
Gold price (XAU/USD) attracts some sellers near $5,035 during the early Asian session on Tuesday. The precious metal edges lower amid improved risk sentiment and some profit-taking. Traders brace for key US economic data later this week, including delayed employment and inflation reports. 
placeholder
Bitcoin Reclaims $70,000. Cathie Wood Claims Near Potential Bottom, Will This Time Be Different?Bitcoin price rebounds above $70,000; Cathie Wood calls a "potential bottom" again, but the reality may differ.On Monday (February 9), Bitcoin ( BTC) price momentum has stalled, fluctuati
Author  TradingKey
Yesterday 10: 37
Bitcoin price rebounds above $70,000; Cathie Wood calls a "potential bottom" again, but the reality may differ.On Monday (February 9), Bitcoin ( BTC) price momentum has stalled, fluctuati
placeholder
A Crash After a Surge: Why Silver Lost 40% in a Week?TradingKey - Spot Silver ( XAGUSD) prices have continued to decline; on Thursday, silver plummeted as much as 20% to break below $71 per ounce, and on Friday the sell-off intensified as prices fell fu
Author  TradingKey
Feb 06, Fri
TradingKey - Spot Silver ( XAGUSD) prices have continued to decline; on Thursday, silver plummeted as much as 20% to break below $71 per ounce, and on Friday the sell-off intensified as prices fell fu
placeholder
Bitcoin is trading around $63,000, down nearly 40% from its peak near $126,000Wall Street desks are no longer talking about upside dreams. The talk right now is how far Bitcoin charts could fall if selling keeps piling up. According to data from TradingView, Bitcoin’s price now sits at a shocking $63,500, after falling from $70,000 just this morning, losing $13,000 in 6 days, and staying far below […]
Author  Cryptopolitan
Feb 06, Fri
Wall Street desks are no longer talking about upside dreams. The talk right now is how far Bitcoin charts could fall if selling keeps piling up. According to data from TradingView, Bitcoin’s price now sits at a shocking $63,500, after falling from $70,000 just this morning, losing $13,000 in 6 days, and staying far below […]
Related Instrument
goTop
quote