USD/CAD Price Analysis: Extends its upside on unexpectedly robust preliminary US PMI growth

Source Fxstreet
  • USD/CAD bounces back strongly after upbeat US preliminary S&P Global PMI report for June.
  • Canadian Retail Sales grew expectedly by 0.7%.
  • The Fed is expected to deliver two rate cuts this year.

The USD/CAD pair recovers strongly from 11-day low near 1.3670 in Friday’s American session. The Loonie asset bounces back as the US Dollar (USD) extends its upside after the US S&P Global PMI data for June shows that the Composite PMI surprisingly outperformed expectations that were pointing to slowdown in activity.

The US Dollar Index (DXY), which tracks the Greenback’s value against six major currencies, jumps to six-week high near 105.90.

However, investors are still uncertain about the US Dollar’s outlook as investors expect that the Federal Reserve (Fed) will start reducing interest rates from the September meeting. Market participants expect that the Fed will cut interest rates twice this year. On the contrary, Fed policymakers continue to argue in favor of reducing interest rates only once this year.

Meanwhile, the Canadian Dollar barely moved as Canada’s Retail Sales for April grew in line with expectations of 0.7% month-on-month. The Retail Sales data comes out positive after contracting for straight three months.

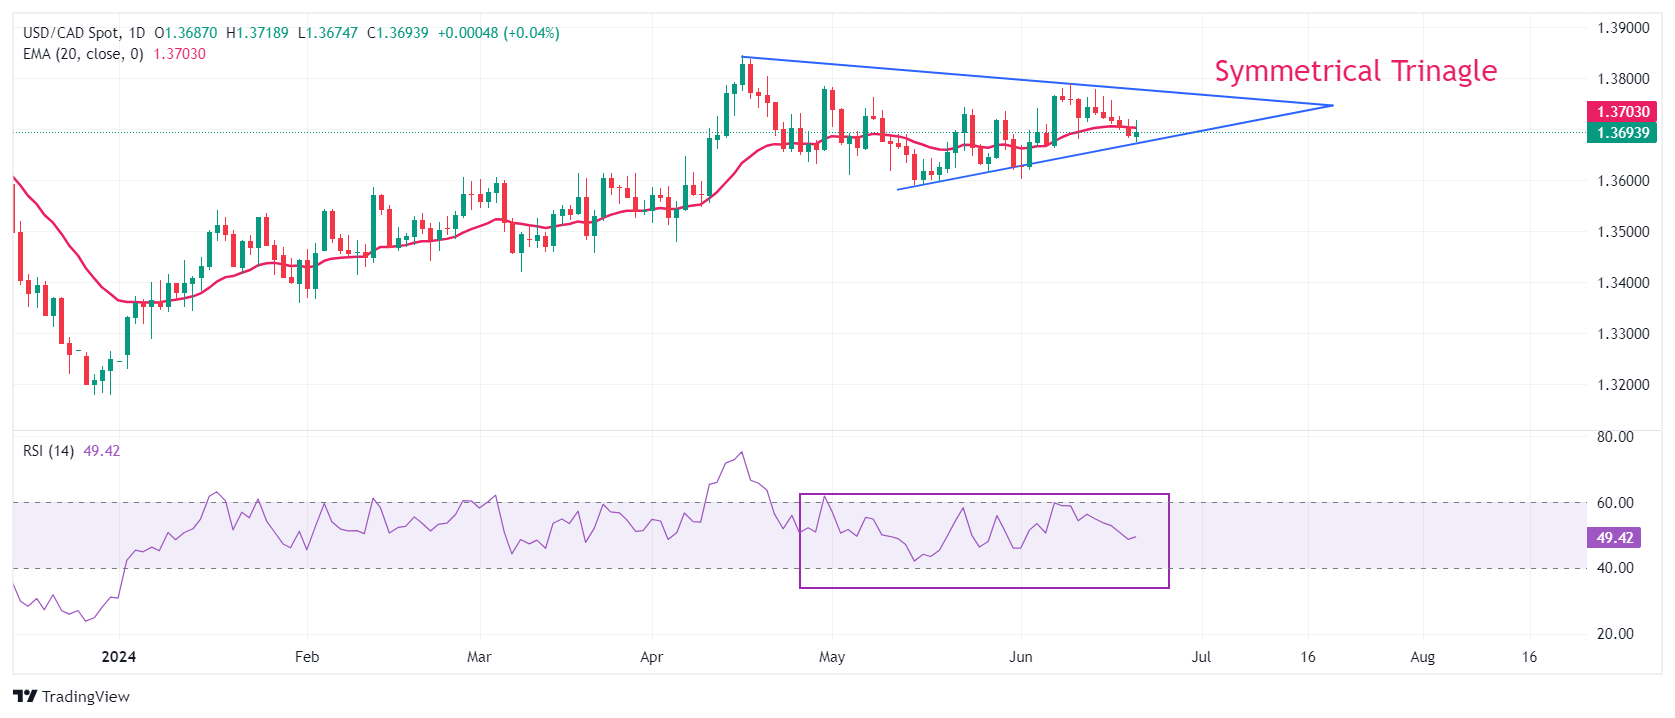
USD/CAD trades in a Symmetrical Triangle chart pattern, which indicates a sharp volatility contraction. Spot prices remain sticky to the 20-day Exponential Moving Average (EMA) near 1.3700, indicating a sideways trend.

The 14-period Relative Strength Index (RSI) oscillates in the 40.00-60.00 range, suggesting indecisiveness among market participants.

Fresh buying opportunity would emerge if the asset breaks above April 17 high at 1.3838. This would drive the asset towards 1 November 2023 high at 1.3900, followed by the psychological resistance of 1.4000.

In an alternate scenario, a breakdown below June 7 low at 1.3663 will expose the asset to May 3 low around 1.3600 and April 9 low around 1.3547.

USD/CAD daily chart

USD/CAD

Overview
Today last price 1.3692
Today Daily Change 0.0003
Today Daily Change % 0.02
Today daily open 1.3689
 
Trends
Daily SMA20 1.3698
Daily SMA50 1.3698
Daily SMA100 1.3615
Daily SMA200 1.3584
 
Levels
Previous Daily High 1.3721
Previous Daily Low 1.3682
Previous Weekly High 1.3792
Previous Weekly Low 1.368
Previous Monthly High 1.3783
Previous Monthly Low 1.359
Daily Fibonacci 38.2% 1.3697
Daily Fibonacci 61.8% 1.3706
Daily Pivot Point S1 1.3674
Daily Pivot Point S2 1.3659
Daily Pivot Point S3 1.3635
Daily Pivot Point R1 1.3713
Daily Pivot Point R2 1.3736
Daily Pivot Point R3 1.3751


Disclaimer: For information purposes only. Past performance is not indicative of future results.
placeholder
Top 3 Price Prediction: Bitcoin, Ethereum, Ripple – BTC, ETH and XRP Look for a Foothold After a Sharp ShakeoutBitcoin trades near $92,600 after a dip below $90,000, while Ethereum around $3,118 and XRP near $2.21–$2.23 sit on key support zones, as BTC, ETH and XRP all try to turn a sharp correction into a tradable rebound rather than a deeper slide.
Author  Mitrade
Nov 19, Wed
Bitcoin trades near $92,600 after a dip below $90,000, while Ethereum around $3,118 and XRP near $2.21–$2.23 sit on key support zones, as BTC, ETH and XRP all try to turn a sharp correction into a tradable rebound rather than a deeper slide.
placeholder
Even As Bitcoin's Price Falls, Michael Saylor Feels 'Indestructible'The price of Bitcoin dipped below $89,000, setting a new weekly low as corporate buyer Strategy remains bullish.
Author  Mitrade
Yesterday 03: 08
The price of Bitcoin dipped below $89,000, setting a new weekly low as corporate buyer Strategy remains bullish.
placeholder
Could XRP Really Catch Ethereum? Analysts Revisit the Question as ETF Tailwinds BuildAs US spot XRP ETFs roll out and issuers like Canary Capital and Franklin Templeton step in, analysts say XRP’s market cap could climb on growing utility and ETF accumulation—but overtaking Ethereum’s $373 billion smart-contract powerhouse remains a long-shot, at least for now.
Author  Mitrade
Yesterday 03: 28
As US spot XRP ETFs roll out and issuers like Canary Capital and Franklin Templeton step in, analysts say XRP’s market cap could climb on growing utility and ETF accumulation—but overtaking Ethereum’s $373 billion smart-contract powerhouse remains a long-shot, at least for now.
placeholder
Bitcoin's Drop to $86K Approaches 'Max Pain' Zone, Yet Presents Potential Buying OpportunityAnalysts identify the $84,000 to $73,000 range as Bitcoin's likely "max pain" territory where capitulation may occur.
Author  Mitrade
8 hours ago
Analysts identify the $84,000 to $73,000 range as Bitcoin's likely "max pain" territory where capitulation may occur.
placeholder
Market Meltdown: BTC, ETH, and XRP Capitulate as Bears Seize ControlBitcoin trades around $85,900 after breaking below $86,000, with Ethereum under $2,791 and XRP below $1.99 as BTC, ETH and XRP extend weekly losses of 8–10%, forcing traders to focus on supports at $85,000, $2,749 and $1.77 for clues on whether this sell-off has further to run.
Author  Mitrade
8 hours ago
Bitcoin trades around $85,900 after breaking below $86,000, with Ethereum under $2,791 and XRP below $1.99 as BTC, ETH and XRP extend weekly losses of 8–10%, forcing traders to focus on supports at $85,000, $2,749 and $1.77 for clues on whether this sell-off has further to run.
goTop
quote