NZD/USD Price Analysis: Bears grow stronger, as the pair struggles under the 20-day SMA

Source Fxstreet
  • Despite NZD/USD's attempts to recover losses, another rejection at the 20-day SMA sees a retreat to 0.6122.
  • The short-term outlook is increasingly bearish, with rising selling traction visible.
  • For a break in the bearish outlook, the pair must recover the 20-day SMA at 0.6150.

On Thursday, the NZD/USD extended its losses below the 20-day Simple Moving Average (SMA), its fourth consecutive rejection at this strong support level this week. The pair retreated to 0.6122. Despite attempts to recover losses, indicators are signalling rising bearish traction potentially paving the way for further downside unless the pair can regain control over the 20-day SMA around the 0.6150 mark.

The Relative Strength Index (RSI) of the NZDUSD daily chart positions at 49, slightly below the neutral territory. Compared to Tuesday's reading of 51, the RSI indicators are pointing south, suggesting a potential decrease in the market momentum. Despite near-term downward dynamics, it remains distanced from the oversold conditions. The Moving Average Convergence Divergence (MACD) profile continues to print rising red bars indicating an elevated presence of sellers in the market.

NZD/USD daily chart

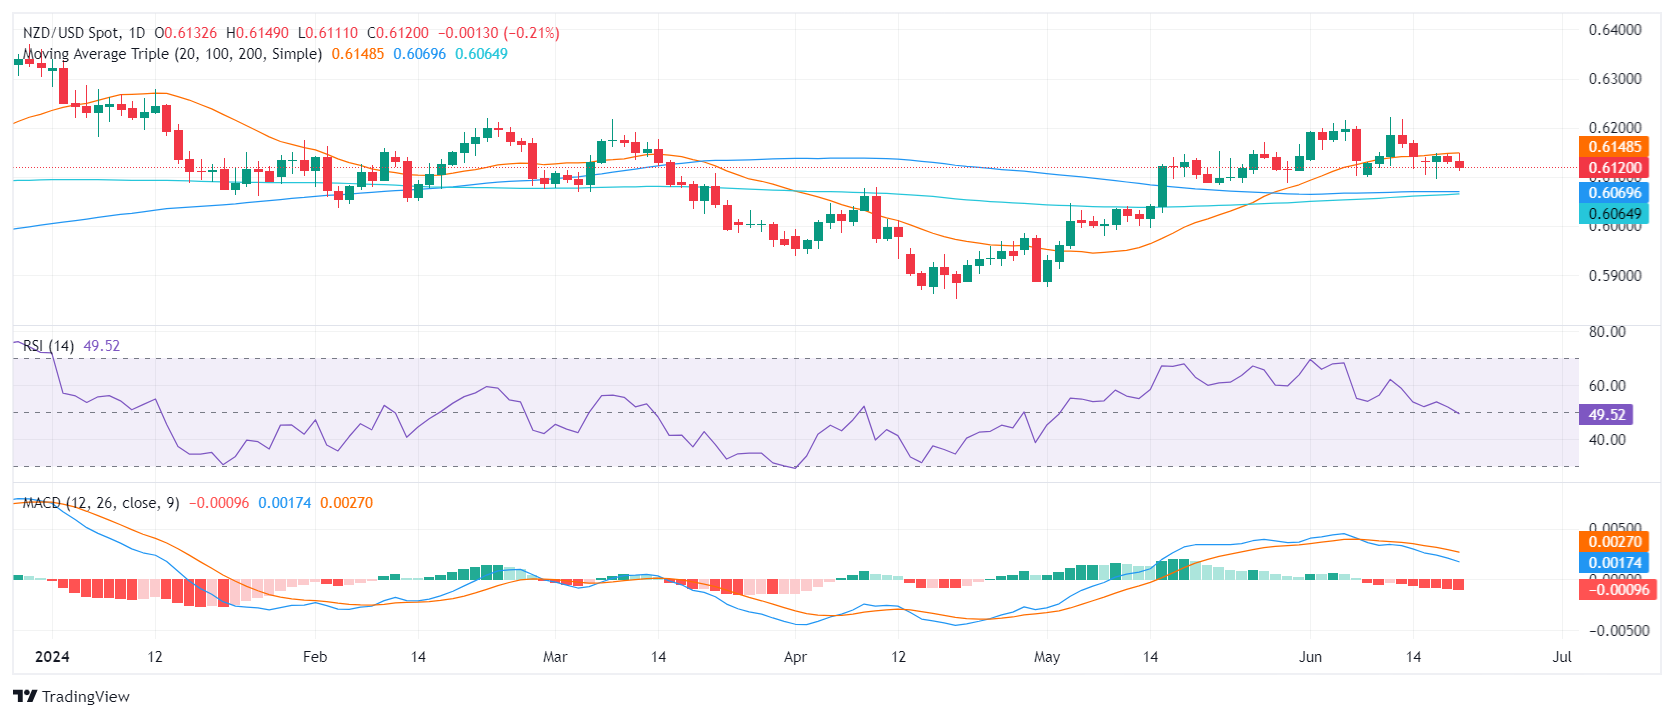
For the NZD/USD, immediate support remains near the 0.6100 level. Further support is available at the convergence of the 100-day and 200-day SMAs at 0.60695 and 0.60627 respectively. These levels could provide a solid foundation in the event of an extension of the downside move. A break below these SMA convergence points might be indicative of a strong sell-off scenario.

In stark contrast, resistance for the pair is entrenched around the 20-day SMA at 0.6150 level. Then higher up at 0.6170 and finally at the 0.6200 level. A decisive breakout above these levels could potentially signify the end of the current bearish market sentiment and a shift toward bullish dynamics.

NZD/USD

Overview
Today last price 0.6124
Today Daily Change -0.0009
Today Daily Change % -0.15
Today daily open 0.6133
 
Trends
Daily SMA20 0.6147
Daily SMA50 0.6053
Daily SMA100 0.607
Daily SMA200 0.6064
 
Levels
Previous Daily High 0.6146
Previous Daily Low 0.6127
Previous Weekly High 0.6222
Previous Weekly Low 0.6099
Previous Monthly High 0.6171
Previous Monthly Low 0.5875
Daily Fibonacci 38.2% 0.6134
Daily Fibonacci 61.8% 0.6139
Daily Pivot Point S1 0.6125
Daily Pivot Point S2 0.6116
Daily Pivot Point S3 0.6106
Daily Pivot Point R1 0.6144
Daily Pivot Point R2 0.6154
Daily Pivot Point R3 0.6163


Disclaimer: For information purposes only. Past performance is not indicative of future results.
placeholder
Pi Network Price Annual Forecast: PI Heads Into a Volatile 2026 as Utility Questions Collide With Big UnlocksPi Network heads into 2026 after a 90%+ 2025 drawdown from $3.00, with 17.5 million KYC users and a smart-contract-focused Stellar v23 upgrade offering upside potential, but 1.21 billion tokens unlocking and heavy exchange deposits (437 million PI) keeping supply pressure and trust risks firmly in focus.
Author  Mitrade
Dec 19, 2025
Pi Network heads into 2026 after a 90%+ 2025 drawdown from $3.00, with 17.5 million KYC users and a smart-contract-focused Stellar v23 upgrade offering upside potential, but 1.21 billion tokens unlocking and heavy exchange deposits (437 million PI) keeping supply pressure and trust risks firmly in focus.
placeholder
Markets in 2026: Will gold, Bitcoin, and the U.S. dollar make history again? — These are how leading institutions thinkAfter a turbulent 2025, what lies ahead for commodities, forex, and cryptocurrency markets in 2026?
Author  Insights
Dec 25, 2025
After a turbulent 2025, what lies ahead for commodities, forex, and cryptocurrency markets in 2026?
placeholder
ECB Policy Outlook for 2026: What It Could Mean for the Euro’s Next MoveWith the ECB likely holding rates steady at 2.15% and the Fed potentially extending cuts into 2026, EUR/USD may test 1.20 if Eurozone growth proves resilient, but weaker growth and an ECB pivot could pull the pair back toward 1.13 and potentially 1.10.
Author  Mitrade
Dec 26, 2025
With the ECB likely holding rates steady at 2.15% and the Fed potentially extending cuts into 2026, EUR/USD may test 1.20 if Eurozone growth proves resilient, but weaker growth and an ECB pivot could pull the pair back toward 1.13 and potentially 1.10.
placeholder
Top Crypto Losers: BCH, HYPE, PUMP extend losses as Bitcoin drops below $64,000Altcoins, including Bitcoin Cash (BCH), Hyperliquid (HYPE), and Pump.fun (PUMP), are leading losses over the last 24 hours as Bitcoin falls below $64,000 on Tuesday. The technical outlook for BCH, HYPE, and PUMP flags downside risk amid broader market selling.
Author  FXStreet
Feb 24, Tue
Altcoins, including Bitcoin Cash (BCH), Hyperliquid (HYPE), and Pump.fun (PUMP), are leading losses over the last 24 hours as Bitcoin falls below $64,000 on Tuesday. The technical outlook for BCH, HYPE, and PUMP flags downside risk amid broader market selling.
placeholder
Gold advances back closer to $5,200 mark amid geopolitical tensions and USD weaknessGold (XAU/USD) attracts some dip-buyers following the previous day's modest pullback from the monthly top and climbs back closer to the $5,200 mark during the Asian session on Wednesday.
Author  FXStreet
18 hours ago
Gold (XAU/USD) attracts some dip-buyers following the previous day's modest pullback from the monthly top and climbs back closer to the $5,200 mark during the Asian session on Wednesday.
Related Instrument
goTop
quote