GBP/USD Price Analysis: Climbs back above 1.2700 on US holiday

Source Fxstreet
  • GBP/USD tests key-support trendline turned resistance at around 1.2730.
  • Technical outlook shows momentum favoring buyers, but unable to sustain gains above 1.2800.
  • Key resistance at 1.2739 and 1.2800, with support levels at 1.2700, 1.2643, and 1.2617.

The Pound Sterling modestly gains versus the Greenback on Wednesday, amid thin liquidity conditions, due to US traders being in observance of Juneteenth. Therefore, with US markets being closed, the GBP/USD could remain subdued, and trade at 1.2729 at the time of writing.

GBP/USD Price Analysis: Technical outlook

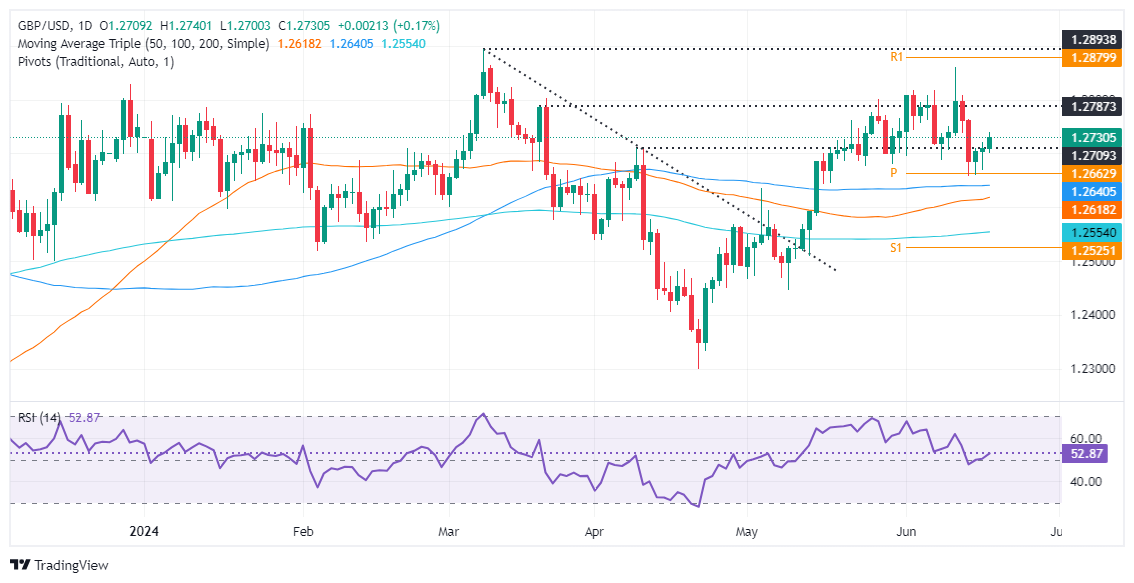
After hitting a three-month high at 1.2860, the GBP/SD dropped more than 100 pips and cleared a support trendline drawn from lows of May 17 that passes at around 1.2730.

Although momentum favors buyers with the Relative Strength Index (RSI) above the 50-neutral line, the major has failed to sustain the uptrend above 1.2800.

Risk events, like the latest inflation report, could not lift the GBP/USD close to 1.2800. That, along with Thursday’s Bank of England decision, will keep the pair trading volatile in the upcoming days.

Key resistance levels lie at 1.2739, the current week’s high, followed by 1.2800. Once cleared, the next stop would be the monthly high of 1.2860.

Conversely, if GBP/USD stumbles past 1.2700, that will expose the confluence of technical indicators, like the May 3 high turned support and the 50-day moving average (DMA) at 1.2643/39, ahead of the 50-DMA at 1.2617. Further losses lie once cleared, like the 1.2600 figure and the 200-DMA at 1.2550.

GBP/USD Price Action – Daily Chart
GBP/USD

Overview
Today last price 1.273
Today Daily Change 0.0021
Today Daily Change % 0.17
Today daily open 1.2709
 
Trends
Daily SMA20 1.2743
Daily SMA50 1.2614
Daily SMA100 1.264
Daily SMA200 1.2553
 
Levels
Previous Daily High 1.2721
Previous Daily Low 1.2669
Previous Weekly High 1.286
Previous Weekly Low 1.2657
Previous Monthly High 1.2801
Previous Monthly Low 1.2446
Daily Fibonacci 38.2% 1.2701
Daily Fibonacci 61.8% 1.2689
Daily Pivot Point S1 1.2679
Daily Pivot Point S2 1.2648
Daily Pivot Point S3 1.2627
Daily Pivot Point R1 1.273
Daily Pivot Point R2 1.2752
Daily Pivot Point R3 1.2782


Disclaimer: For information purposes only. Past performance is not indicative of future results.
placeholder
Top 3 Price Prediction: Bitcoin, Ethereum, Ripple – BTC, ETH and XRP Look for a Foothold After a Sharp ShakeoutBitcoin trades near $92,600 after a dip below $90,000, while Ethereum around $3,118 and XRP near $2.21–$2.23 sit on key support zones, as BTC, ETH and XRP all try to turn a sharp correction into a tradable rebound rather than a deeper slide.
Author  Mitrade
Nov 19, Wed
Bitcoin trades near $92,600 after a dip below $90,000, while Ethereum around $3,118 and XRP near $2.21–$2.23 sit on key support zones, as BTC, ETH and XRP all try to turn a sharp correction into a tradable rebound rather than a deeper slide.
placeholder
Bitcoin Volatility Spikes: Is Options-Driven Pricing Making a Comeback?Bitcoin's volatility is surging, suggesting a shift back to options-driven price action seen before Bitcoin ETFs were launched.
Author  Mitrade
Nov 24, Mon
Bitcoin's volatility is surging, suggesting a shift back to options-driven price action seen before Bitcoin ETFs were launched.
placeholder
Gold Price Forecast: XAU/USD rises to near $4,150 as Fed rate cut bets growGold price (XAU/USD) attracts some buyers to around $4,140 during the early Asian session on Tuesday. The precious metal rises on growing expectations of a US Federal Reserve (Fed) interest rate cut in the December policy meeting.
Author  FXStreet
Yesterday 01: 29
Gold price (XAU/USD) attracts some buyers to around $4,140 during the early Asian session on Tuesday. The precious metal rises on growing expectations of a US Federal Reserve (Fed) interest rate cut in the December policy meeting.
placeholder
Bitcoin Bleeds to $86K, But This Key Indicator Screams "The Top Isn't In"Bitcoin’s adjusted Spent Output Profit Ratio (aSOPR) has spent nearly two years coiling below the extremes seen at past bull-market peaks, even as BTC trades around $86,300 and down 9% on the week — a setup that leaves open the possibility that this cycle’s true top may still lie ahead.
Author  Mitrade
Yesterday 07: 27
Bitcoin’s adjusted Spent Output Profit Ratio (aSOPR) has spent nearly two years coiling below the extremes seen at past bull-market peaks, even as BTC trades around $86,300 and down 9% on the week — a setup that leaves open the possibility that this cycle’s true top may still lie ahead.
placeholder
Bitcoin Price Rebound Gains Traction with $90K Break in SightBitcoin is trading above $87,000 and its 100-hour SMA after rebounding from $83,500, with a bearish trend line at $88,200 and resistance at $89,000–$90,000 now in focus as BTC either breaks higher toward $91,750–$94,000 or slips back toward $86,700, $85,000 and lower supports.
Author  Mitrade
7 hours ago
Bitcoin is trading above $87,000 and its 100-hour SMA after rebounding from $83,500, with a bearish trend line at $88,200 and resistance at $89,000–$90,000 now in focus as BTC either breaks higher toward $91,750–$94,000 or slips back toward $86,700, $85,000 and lower supports.
goTop
quote