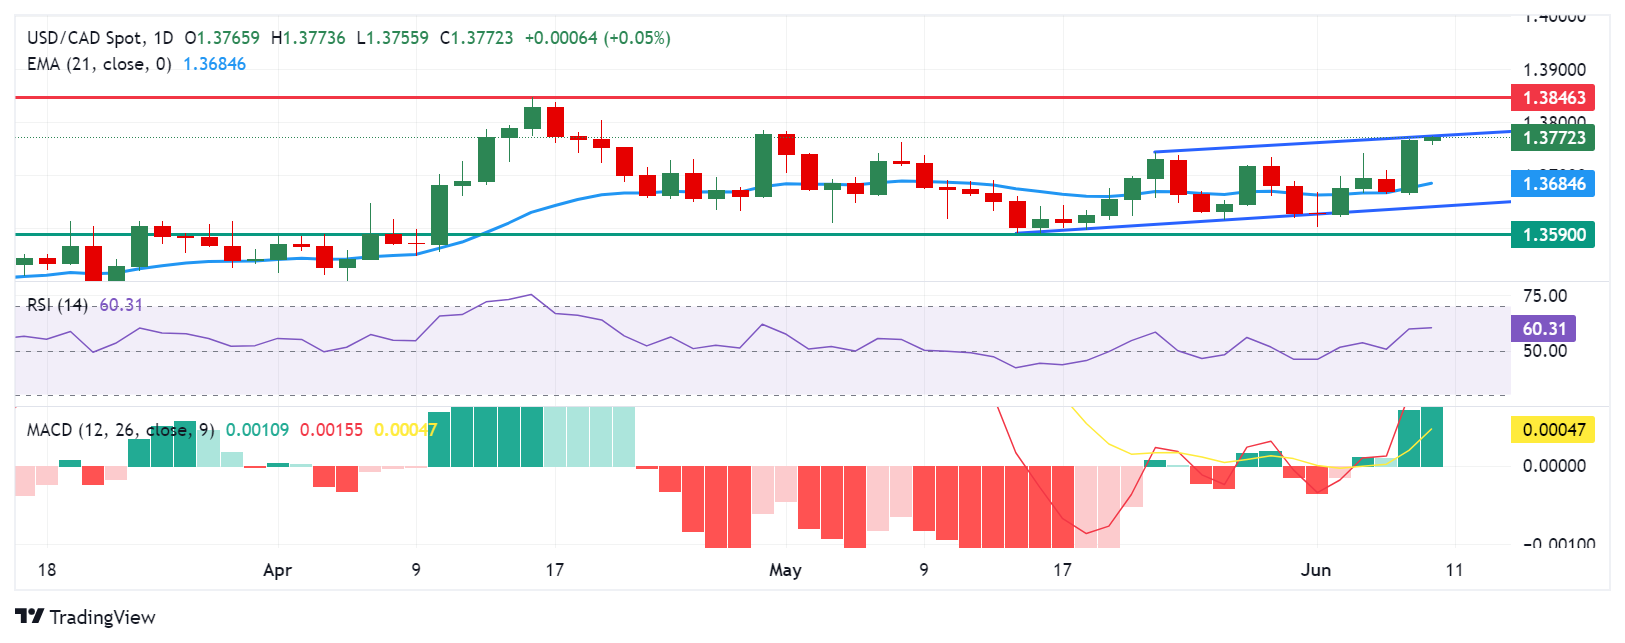
USD/CAD Price Analysis: Hovers above 1.3750, barrier at upper boundary of the channel

Source Fxstreet
  • USD/CAD could test the upper boundary of the rising channel around the level of 1.3775.
  • The momentum indicator 14-day RSI suggests an emergence of a bullish bias.
  • A break below the 21-day EMA could lead the pair to test the lower threshold of the rising channel around the level of 1.3640.

USD/CAD holds its position around 1.3760 during the early European session on Monday following the recent gains recorded in the previous trading day. Analysis of the daily chart suggests an emergence of a bullish bias for the USD/CAD pair, as it moves within the rising channel pattern.

Moreover, the momentum indicator 14-day Relative Strength Index (RSI) is positioned above the 50 level. The Moving Average Convergence Divergence (MACD) indicator suggests a confirmation of the bullish bias for the pair as the MACD line is positioned above the centerline, it shows divergence above the signal line.

The USD/CAD pair tests the upper boundary of the rising channel around the level of 1.3775, followed by the key barrier at the psychological level of 1.3800. A breakthrough above the latter level could provide support for the pair to explore the region April’s high of 1.3846.

On the downside, the USD/CAD pair could find key support around the 21-day Exponential Moving Average (EMA) of 1.3684 level. A break below this level could exert pressure on the pair to navigate the region around the lower threshold of the rising channel around the level of 1.3640, followed by the throwback support at 1.3590.

USD/CAD: Daily Chart

USD/CAD

Overview
Today last price 1.3769
Today Daily Change 0.0003
Today Daily Change % 0.02
Today daily open 1.3766
 
Trends
Daily SMA20 1.3663
Daily SMA50 1.3673
Daily SMA100 1.359
Daily SMA200 1.3578
 
Levels
Previous Daily High 1.3768
Previous Daily Low 1.3663
Previous Weekly High 1.3768
Previous Weekly Low 1.3603
Previous Monthly High 1.3783
Previous Monthly Low 1.359
Daily Fibonacci 38.2% 1.3728
Daily Fibonacci 61.8% 1.3703
Daily Pivot Point S1 1.3697
Daily Pivot Point S2 1.3628
Daily Pivot Point S3 1.3592
Daily Pivot Point R1 1.3801
Daily Pivot Point R2 1.3837
Daily Pivot Point R3 1.3906


Disclaimer: For information purposes only. Past performance is not indicative of future results.
placeholder
2025 Black Friday is coming! Which stocks may see volatility?Coming on the day right after Thanksgiving in the United States, Back Friday marks the start of the holiday shopping season. Sales data from this shopping frenzy day reflects investor confidence and consumer trends. The National Retail Federation (NRF) predicts that holiday season (Nov and Dec) retail sales in 2025 will likely exceed $1 trillion for the very first time, which represents a year-over-year increase of 3.7 to 4.2 percent. Historic data from the past decade show that the retail sector has generally outperformed the S&P 500 during the weeks before and after Black Friday. The following retailing companies are expected to be big winners:
Author  Insights
Nov 24, Mon
Coming on the day right after Thanksgiving in the United States, Back Friday marks the start of the holiday shopping season. Sales data from this shopping frenzy day reflects investor confidence and consumer trends. The National Retail Federation (NRF) predicts that holiday season (Nov and Dec) retail sales in 2025 will likely exceed $1 trillion for the very first time, which represents a year-over-year increase of 3.7 to 4.2 percent. Historic data from the past decade show that the retail sector has generally outperformed the S&P 500 during the weeks before and after Black Friday. The following retailing companies are expected to be big winners:
placeholder
Bitcoin Price Rebound Gains Traction with $90K Break in SightBitcoin is trading above $87,000 and its 100-hour SMA after rebounding from $83,500, with a bearish trend line at $88,200 and resistance at $89,000–$90,000 now in focus as BTC either breaks higher toward $91,750–$94,000 or slips back toward $86,700, $85,000 and lower supports.
Author  Mitrade
Nov 26, Wed
Bitcoin is trading above $87,000 and its 100-hour SMA after rebounding from $83,500, with a bearish trend line at $88,200 and resistance at $89,000–$90,000 now in focus as BTC either breaks higher toward $91,750–$94,000 or slips back toward $86,700, $85,000 and lower supports.
placeholder
Bitcoin Targets $89K Breakout as S&P 500 Nears ATH on Fed Rate Cut HopesBitcoin price action shows signs of a potential short squeeze as it hovers near $88,000, with analysts watching liquidity dynamics that could push it toward $89,000 or retrace to $85,000.
Author  Mitrade
23 hours ago
Bitcoin price action shows signs of a potential short squeeze as it hovers near $88,000, with analysts watching liquidity dynamics that could push it toward $89,000 or retrace to $85,000.
placeholder
Ethereum Reclaims $3K Handle—Is a Breakout Imminent?Ethereum has jumped back above $3,000 and reclaimed key Fib levels, with a bullish trend line at $2,880 and strong MACD/RSI readings putting a breakout above $3,120–$3,165 — and a possible run toward $3,320–$3,350 — on the table, as long as support around $2,980–$2,920 holds.
Author  Mitrade
23 hours ago
Ethereum has jumped back above $3,000 and reclaimed key Fib levels, with a bullish trend line at $2,880 and strong MACD/RSI readings putting a breakout above $3,120–$3,165 — and a possible run toward $3,320–$3,350 — on the table, as long as support around $2,980–$2,920 holds.
placeholder
Bitcoin Price Forecast: BTC extends recovery as ETF records positive flows Bitcoin (BTC) price continues to trade in green above $91,500 at the time of writing on Thursday after rebounding from the key support level.
Author  FXStreet
16 hours ago
Bitcoin (BTC) price continues to trade in green above $91,500 at the time of writing on Thursday after rebounding from the key support level.
goTop
quote