NZD/USD Price Analysis: Bulls reclaim ground but momentum flattens

Source Fxstreet
  • The NZD/USD is currently in a consolidation phase following last week's rally.
  • The pair is building support around the 0.6050-0.6100 area.
  • Indicators are deep in the positive area on the daily chart and hourly indicators decelerated.

The NZD/USD pair witnessed a rise, trading at a high of 0.6160 before stabilizing at 0.6145 as the pair entered a consolidation phase.

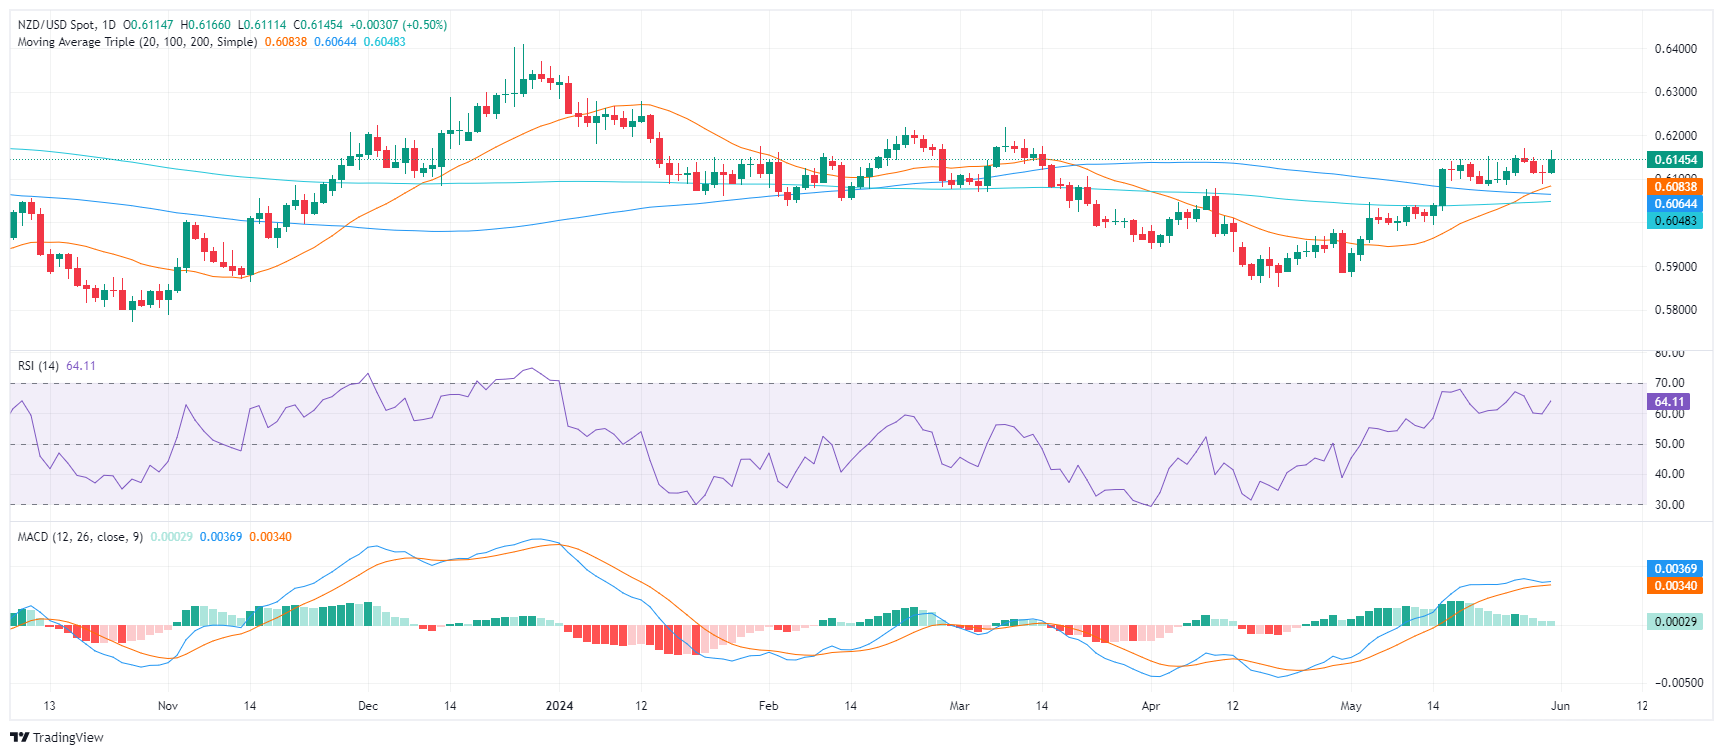
In the daily chart, the Relative Strength Index (RSI) improved with the latest readings at 64, suggesting increased buying pressure. This rise in the RSI matches with the steady presence of green bars on the Moving Average Convergence Divergence (MACD), hinting at an ongoing upward trend.

NZD/USD daily chart

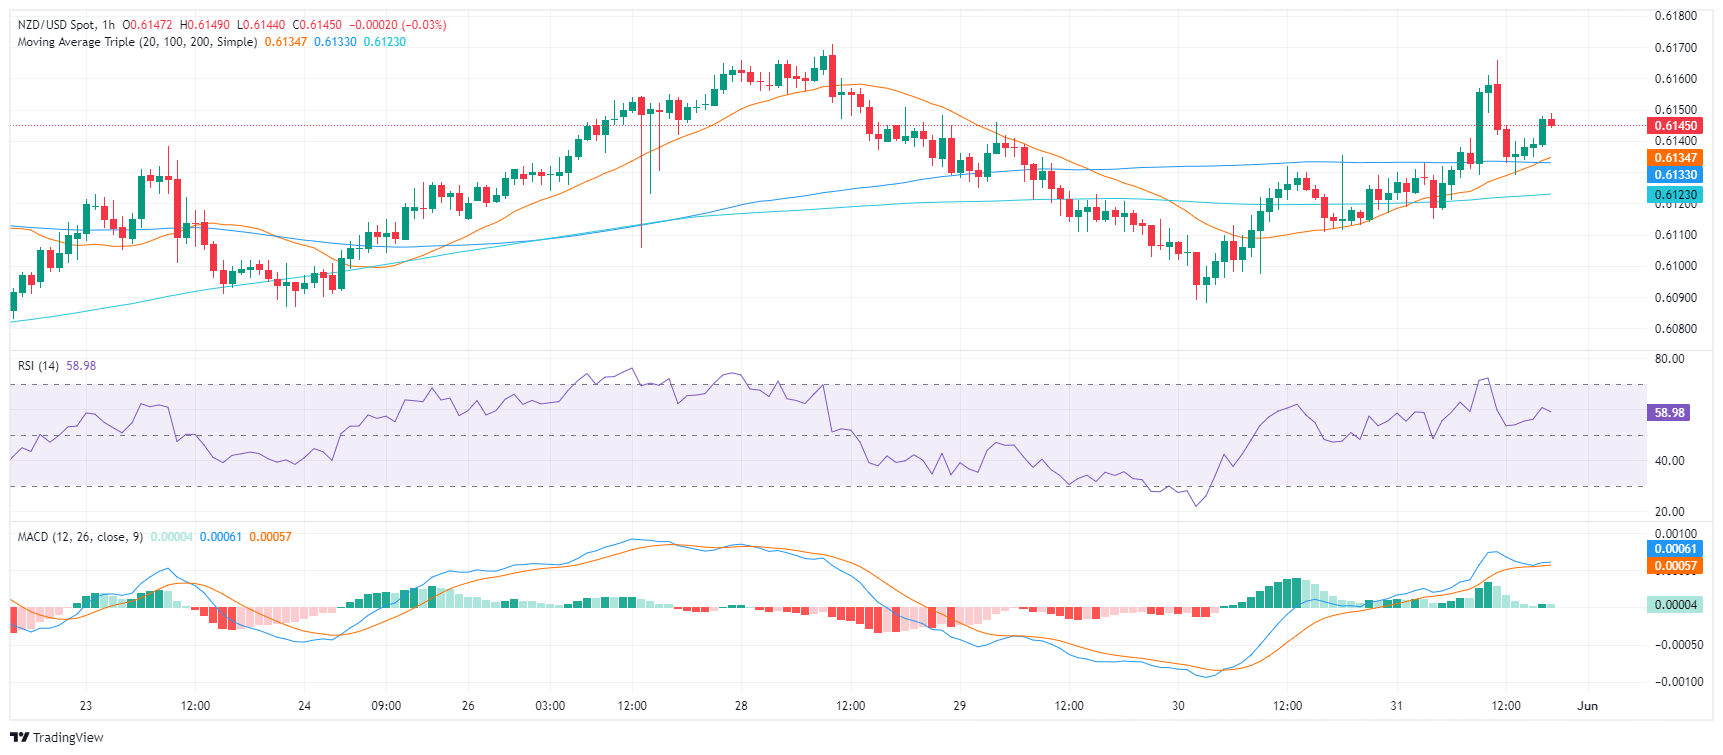
Zooming in, hourly indicators remain in positive area but somewhat flattened with the RSI at 58 and the MACD printing flat green bars.

NZD/USD hourly chart

Additionally, the NZD/USD continues its strong upward trend, with the convergence of its 20, 100, and 200-day Simple Moving Averages (SMAs) in the 0.6050-0.6100 region providing strong support for the pair. Despite any data that may indicate a stabilizing NZD, the technical indicators reflect ongoing bullish activity. Any movements below this convergence could be considered a sell signal.

NZD/USD

Overview
Today last price 0.6146
Today Daily Change 0.0031
Today Daily Change % 0.51
Today daily open 0.6115
 
Trends
Daily SMA20 0.6077
Daily SMA50 0.6008
Daily SMA100 0.6065
Daily SMA200 0.6047
 
Levels
Previous Daily High 0.6132
Previous Daily Low 0.6088
Previous Weekly High 0.6153
Previous Weekly Low 0.6083
Previous Monthly High 0.6079
Previous Monthly Low 0.5851
Daily Fibonacci 38.2% 0.6105
Daily Fibonacci 61.8% 0.6115
Daily Pivot Point S1 0.6091
Daily Pivot Point S2 0.6068
Daily Pivot Point S3 0.6047
Daily Pivot Point R1 0.6135
Daily Pivot Point R2 0.6156
Daily Pivot Point R3 0.6179


Disclaimer: For information purposes only. Past performance is not indicative of future results.
placeholder
Top 3 Price Prediction: Bitcoin, Ethereum, Ripple – BTC, ETH and XRP Look for a Foothold After a Sharp ShakeoutBitcoin trades near $92,600 after a dip below $90,000, while Ethereum around $3,118 and XRP near $2.21–$2.23 sit on key support zones, as BTC, ETH and XRP all try to turn a sharp correction into a tradable rebound rather than a deeper slide.
Author  Mitrade
Nov 19, Wed
Bitcoin trades near $92,600 after a dip below $90,000, while Ethereum around $3,118 and XRP near $2.21–$2.23 sit on key support zones, as BTC, ETH and XRP all try to turn a sharp correction into a tradable rebound rather than a deeper slide.
placeholder
Even As Bitcoin's Price Falls, Michael Saylor Feels 'Indestructible'The price of Bitcoin dipped below $89,000, setting a new weekly low as corporate buyer Strategy remains bullish.
Author  Mitrade
Yesterday 03: 08
The price of Bitcoin dipped below $89,000, setting a new weekly low as corporate buyer Strategy remains bullish.
placeholder
Could XRP Really Catch Ethereum? Analysts Revisit the Question as ETF Tailwinds BuildAs US spot XRP ETFs roll out and issuers like Canary Capital and Franklin Templeton step in, analysts say XRP’s market cap could climb on growing utility and ETF accumulation—but overtaking Ethereum’s $373 billion smart-contract powerhouse remains a long-shot, at least for now.
Author  Mitrade
Yesterday 03: 28
As US spot XRP ETFs roll out and issuers like Canary Capital and Franklin Templeton step in, analysts say XRP’s market cap could climb on growing utility and ETF accumulation—but overtaking Ethereum’s $373 billion smart-contract powerhouse remains a long-shot, at least for now.
placeholder
Bitcoin's Drop to $86K Approaches 'Max Pain' Zone, Yet Presents Potential Buying OpportunityAnalysts identify the $84,000 to $73,000 range as Bitcoin's likely "max pain" territory where capitulation may occur.
Author  Mitrade
8 hours ago
Analysts identify the $84,000 to $73,000 range as Bitcoin's likely "max pain" territory where capitulation may occur.
placeholder
Market Meltdown: BTC, ETH, and XRP Capitulate as Bears Seize ControlBitcoin trades around $85,900 after breaking below $86,000, with Ethereum under $2,791 and XRP below $1.99 as BTC, ETH and XRP extend weekly losses of 8–10%, forcing traders to focus on supports at $85,000, $2,749 and $1.77 for clues on whether this sell-off has further to run.
Author  Mitrade
8 hours ago
Bitcoin trades around $85,900 after breaking below $86,000, with Ethereum under $2,791 and XRP below $1.99 as BTC, ETH and XRP extend weekly losses of 8–10%, forcing traders to focus on supports at $85,000, $2,749 and $1.77 for clues on whether this sell-off has further to run.
goTop
quote