

EURUSD finishes week near where it started after struggling on Friday
- EUR/USD rose to 1.08800 after better-than-expected EU HICP inflation.
- Pair falls back to the week’s opening bids heading into the close.
- Coming up next week: EU & US PMIs, ECB rate call, US NFP.
EUR/USD struggled to make headway on Friday, splashing around near 1.0850 as the major pair heads into the close within reach of the week’s opening bids on Monday. European Harmonized Index of Consumer Prices (HICP) inflation rose faster than expected in May, while US Personal Consumption Expenditures (PCE) Price Index inflation cooled faster than expected in April. Next week brings a heavy data docket, with Purchasing Managers Index (PMI) figures on both sides of the Atlantic followed by an anticipated rate call from the European Central Bank (ECB) and another print of US Nonfarm Payrolls (NFP) next Friday.
Pan-European Core HICP inflation rose 2.9% MoM in May, above the 2.8% median market forecast and stretching from the previous month’s 2.7%. A sharp downside miss in German Retail Sales in April limited gains for the Euro after consumer activity declined -1.2% MoM versus the expected -0.1%. However, the previous period saw a sharp upside revision to 2.6% from the initial print of 1.8%.
EUR/USD rallied to an intraday high above 1.0880 in European markets, but backslid during the US market session after US PCE Price Index inflation cooled to 0.2% MoM in April. The figure comes in below the expected hold at 0.3%, driven by a sharp easing in US Personal Spending figures, which fell to 0.2% compared to the forecast 0.3% and falling even further from the previous revised print of 0.7%.
The ECB meets next week for another rate call, and markets are increasingly expecting a first quarter-point rate trim from EU central planners after the ECB steadily raised its Main Refinancing Operations Rate from 0.0% in June 2022 to 4.5% in September of 2023.
May’s US ISM PMI figures next Monday are expected to recover to 49.8 from 49.2. Next Friday’s US NFP labor figures loom ahead, and median market forecasts are currently expecting 180K net job additions to the US jobs market in May.
EUR/USD technical outlook
EUR/USD spent the week consolidating around a midrange near 1.0850 as the pair churns just north of the 200-day Exponential Moving Average(EMA) at 1.0793. Daily candlesticks are showing sign of bullish exhaustion and the pair could be due for a bearish breakdown towards the 1.0600 handle. Despite a 2.8% recovery from the last swing low, EUR/USD remains down -1.6% from 2024’s opening bids near 1.1035.
EUR/USD daily chart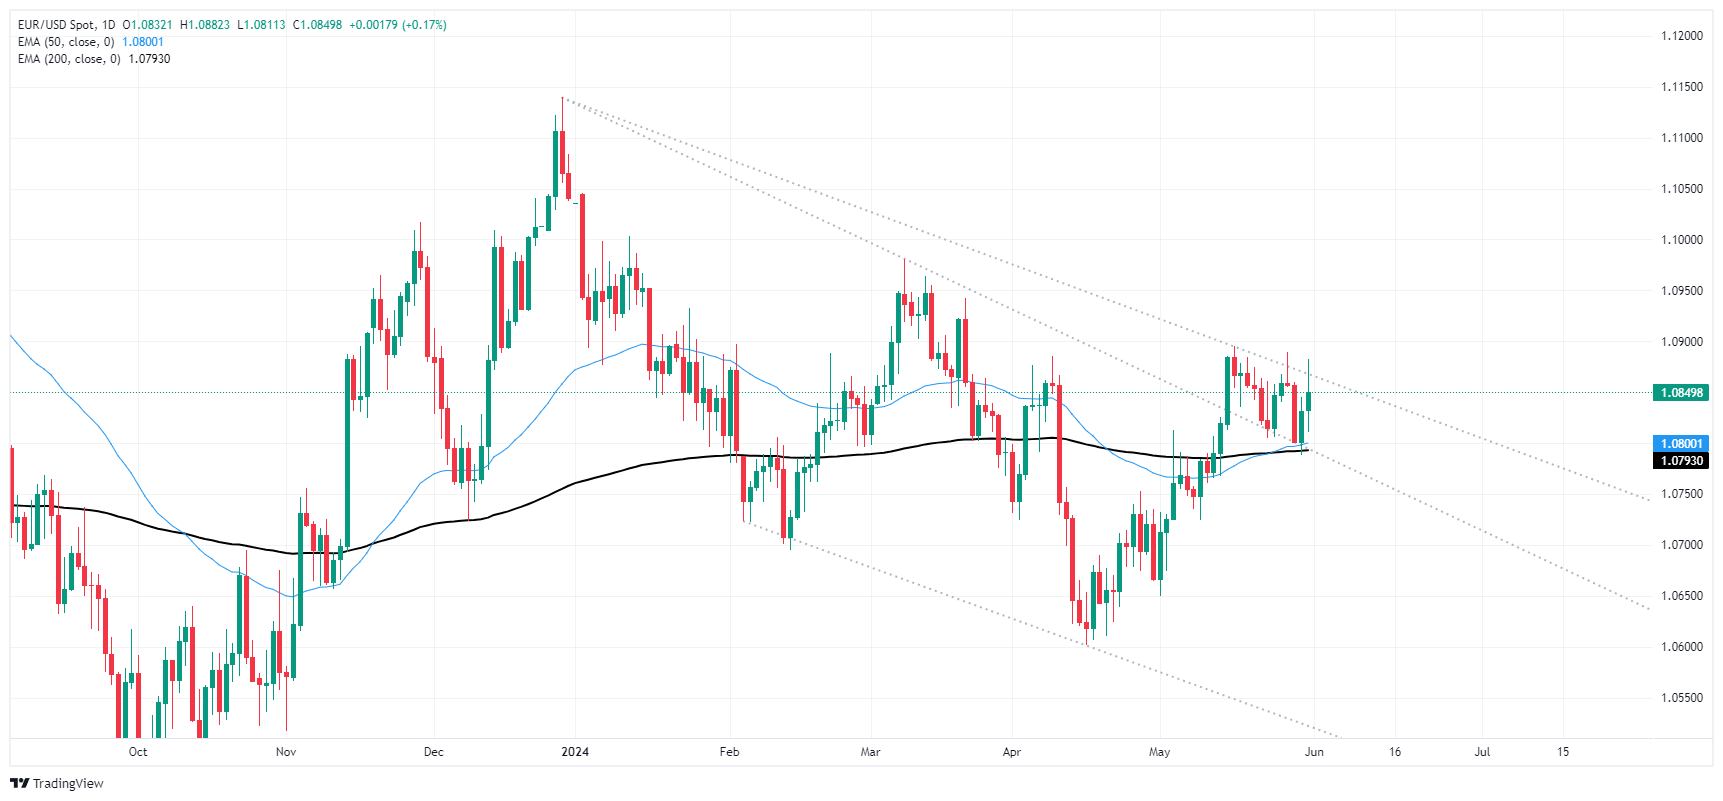
Recommended Articles


