

Canadian Dollar bolstered by weakened Greenback despite softer Canadian GDP
- Broad-market risk appetite recovers on Friday as US PCE inflation eases.
- Canada saw a weaker-than-expected rebound in GDP.
- US PCE inflation cooled further, fueling rate cut hopes.
The Canadian Dollar (CAD) is broadly higher on Friday, but gains are capped after softer-than-expected prints in Canadian economic data. Investor hopes for a September rate cut are riding higher after US Personal Consumption Expenditures (PCE) Price Index inflation eased faster than expected, and rate markets are once again pricing in better-than-even odds of a rate trim from the Federal Reserve (Fed).
Canada saw a slimmer rebound in quarterly Gross Domestic Product (GDP) growth than markets had anticipated, limiting overall gains for the CAD. With US inflation headlines driving broader markets, risk sentiment is on the high side to wrap up the week and investors will be pivoting to next week’s Bank of Canada (BoC) rate call, as well as a batch of US Purchasing Managers Index (PMI) prints and another Nonfarm Payrolls in the pipe for next Friday.
Daily digest market movers: Canadian Dollar bolstered by rising risk appetite tide
- Canadian Q1 GDP rebounded to its highest growth in a year, climbing 1.7% QoQ, despite missing market forecasts of 2.2%.
- The previous quarter’s GDP was also revised sharply lower to just 0.1% versus the initial print of 1.0%.
- US Core PCE Price Index inflation rose 0.2% MoM in April, below the forecast hold at 0.3%.
- US Personal Spending was sharply lower in April, printing at 0.2% versus the forecast 0.3% and even further back from the previous 0.7% (revised from 0.8%).
- According to the CME’s FedWatch Tool, rate markets are now pricing in 56% odds of at least a quarter-point rate cut from the Fed in September.
Canadian Dollar PRICE Today
The table below shows the percentage change of Canadian Dollar (CAD) against listed major currencies today. Canadian Dollar was the strongest against the Japanese Yen.
| USD | EUR | GBP | JPY | CAD | AUD | NZD | CHF | |
|---|---|---|---|---|---|---|---|---|
| USD | -0.13% | 0.02% | 0.25% | -0.38% | -0.15% | -0.36% | -0.00% | |
| EUR | 0.13% | 0.17% | 0.38% | -0.24% | -0.05% | -0.24% | 0.12% | |
| GBP | -0.02% | -0.17% | 0.22% | -0.40% | -0.21% | -0.40% | -0.05% | |
| JPY | -0.25% | -0.38% | -0.22% | -0.61% | -0.40% | -0.64% | -0.27% | |
| CAD | 0.38% | 0.24% | 0.40% | 0.61% | 0.21% | 0.01% | 0.36% | |
| AUD | 0.15% | 0.05% | 0.21% | 0.40% | -0.21% | -0.21% | 0.13% | |
| NZD | 0.36% | 0.24% | 0.40% | 0.64% | -0.01% | 0.21% | 0.35% | |
| CHF | 0.00% | -0.12% | 0.05% | 0.27% | -0.36% | -0.13% | -0.35% |
The heat map shows percentage changes of major currencies against each other. The base currency is picked from the left column, while the quote currency is picked from the top row. For example, if you pick the Canadian Dollar from the left column and move along the horizontal line to the US Dollar, the percentage change displayed in the box will represent CAD (base)/USD (quote).
Technical analysis: Canadian Dollar broadly higher but remains mired in technical congestion
The Canadian Dollar (CAD) has gained ground across the board on Friday, climbing half a percent against the Japanese Yen (JPY). The CAD is also up over a third of a percent against both the Pound Sterling (GBP) and US Dollar (USD) for the day.
USD/CAD has fallen back into the 1.3630 region as the pair hangs on the low end of a near-term congestion pattern. Shortside momentum continues to struggle to find territory near 1.3600, but bidders have been unable to drag prices back above 1.3750.
USD/CAD hourly chart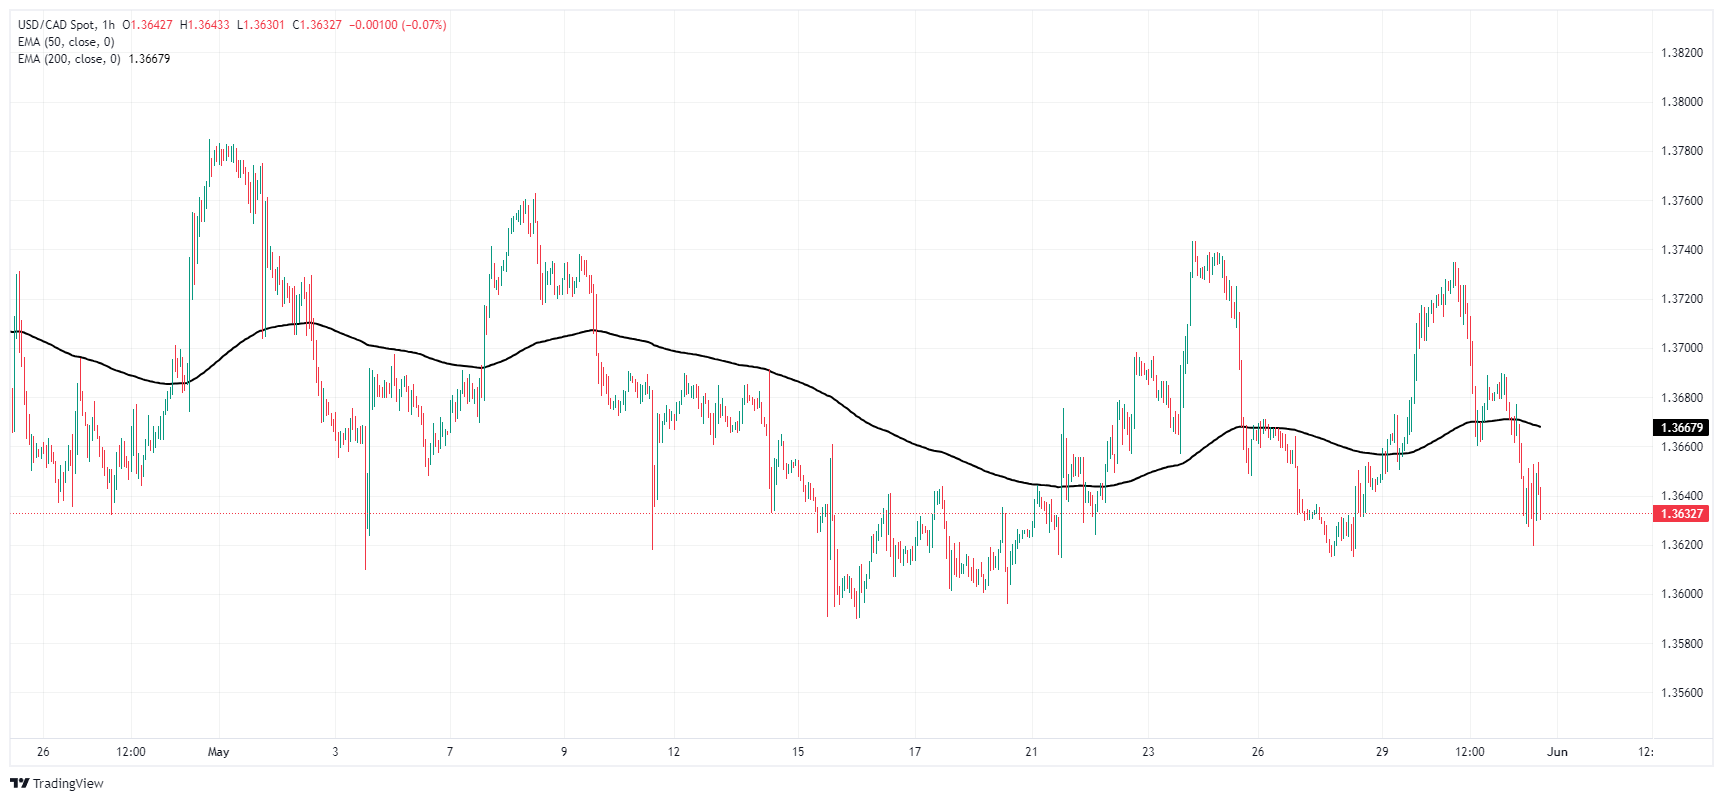
USD/CAD daily chart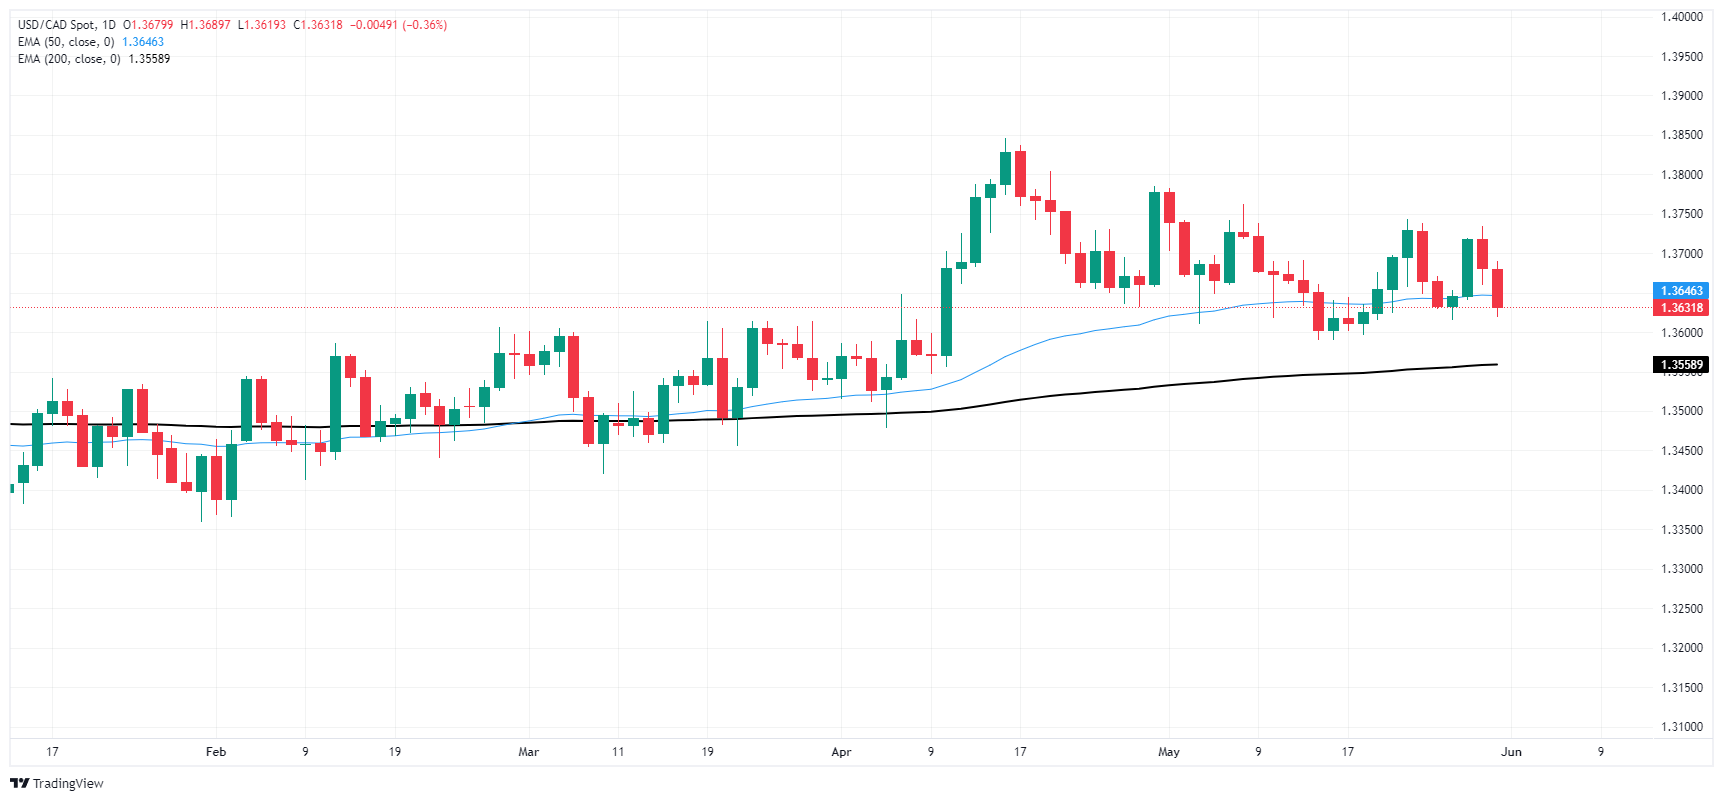
Canadian Dollar FAQs
The key factors driving the Canadian Dollar (CAD) are the level of interest rates set by the Bank of Canada (BoC), the price of Oil, Canada’s largest export, the health of its economy, inflation and the Trade Balance, which is the difference between the value of Canada’s exports versus its imports. Other factors include market sentiment – whether investors are taking on more risky assets (risk-on) or seeking safe-havens (risk-off) – with risk-on being CAD-positive. As its largest trading partner, the health of the US economy is also a key factor influencing the Canadian Dollar.
The Bank of Canada (BoC) has a significant influence on the Canadian Dollar by setting the level of interest rates that banks can lend to one another. This influences the level of interest rates for everyone. The main goal of the BoC is to maintain inflation at 1-3% by adjusting interest rates up or down. Relatively higher interest rates tend to be positive for the CAD. The Bank of Canada can also use quantitative easing and tightening to influence credit conditions, with the former CAD-negative and the latter CAD-positive.
The price of Oil is a key factor impacting the value of the Canadian Dollar. Petroleum is Canada’s biggest export, so Oil price tends to have an immediate impact on the CAD value. Generally, if Oil price rises CAD also goes up, as aggregate demand for the currency increases. The opposite is the case if the price of Oil falls. Higher Oil prices also tend to result in a greater likelihood of a positive Trade Balance, which is also supportive of the CAD.
While inflation had always traditionally been thought of as a negative factor for a currency since it lowers the value of money, the opposite has actually been the case in modern times with the relaxation of cross-border capital controls. Higher inflation tends to lead central banks to put up interest rates which attracts more capital inflows from global investors seeking a lucrative place to keep their money. This increases demand for the local currency, which in Canada’s case is the Canadian Dollar.
Macroeconomic data releases gauge the health of the economy and can have an impact on the Canadian Dollar. Indicators such as GDP, Manufacturing and Services PMIs, employment, and consumer sentiment surveys can all influence the direction of the CAD. A strong economy is good for the Canadian Dollar. Not only does it attract more foreign investment but it may encourage the Bank of Canada to put up interest rates, leading to a stronger currency. If economic data is weak, however, the CAD is likely to fall.
Recommended Articles


