AUD/USD Price Analysis: Up leg within sideways trend approaches ceiling

Source Fxstreet
  • AUD/USD is unfolding an up leg within a range which is approaching the range highs. 
  • If it reaches the highs the pair could reverse and begin a move south, extending the sideways trend. 
  • A clear breakout above the range highs or lows would be required to give the pair directionality again.

AUD/USD trades about a half of a percent higher in the 0.6660s on Friday as the pair continues rising following a bounce from the May 24 swing lows. 

The pair has probably entered a sideways trend and since “the trend is your friend” this range-bound market mode is likely to extend. The range the Aussie finds itself trading in appears to have a high at the May 26 high of 0.6680 and a floor at 0.6591 (May 30 low). 

AUD/USD 4-hour Chart
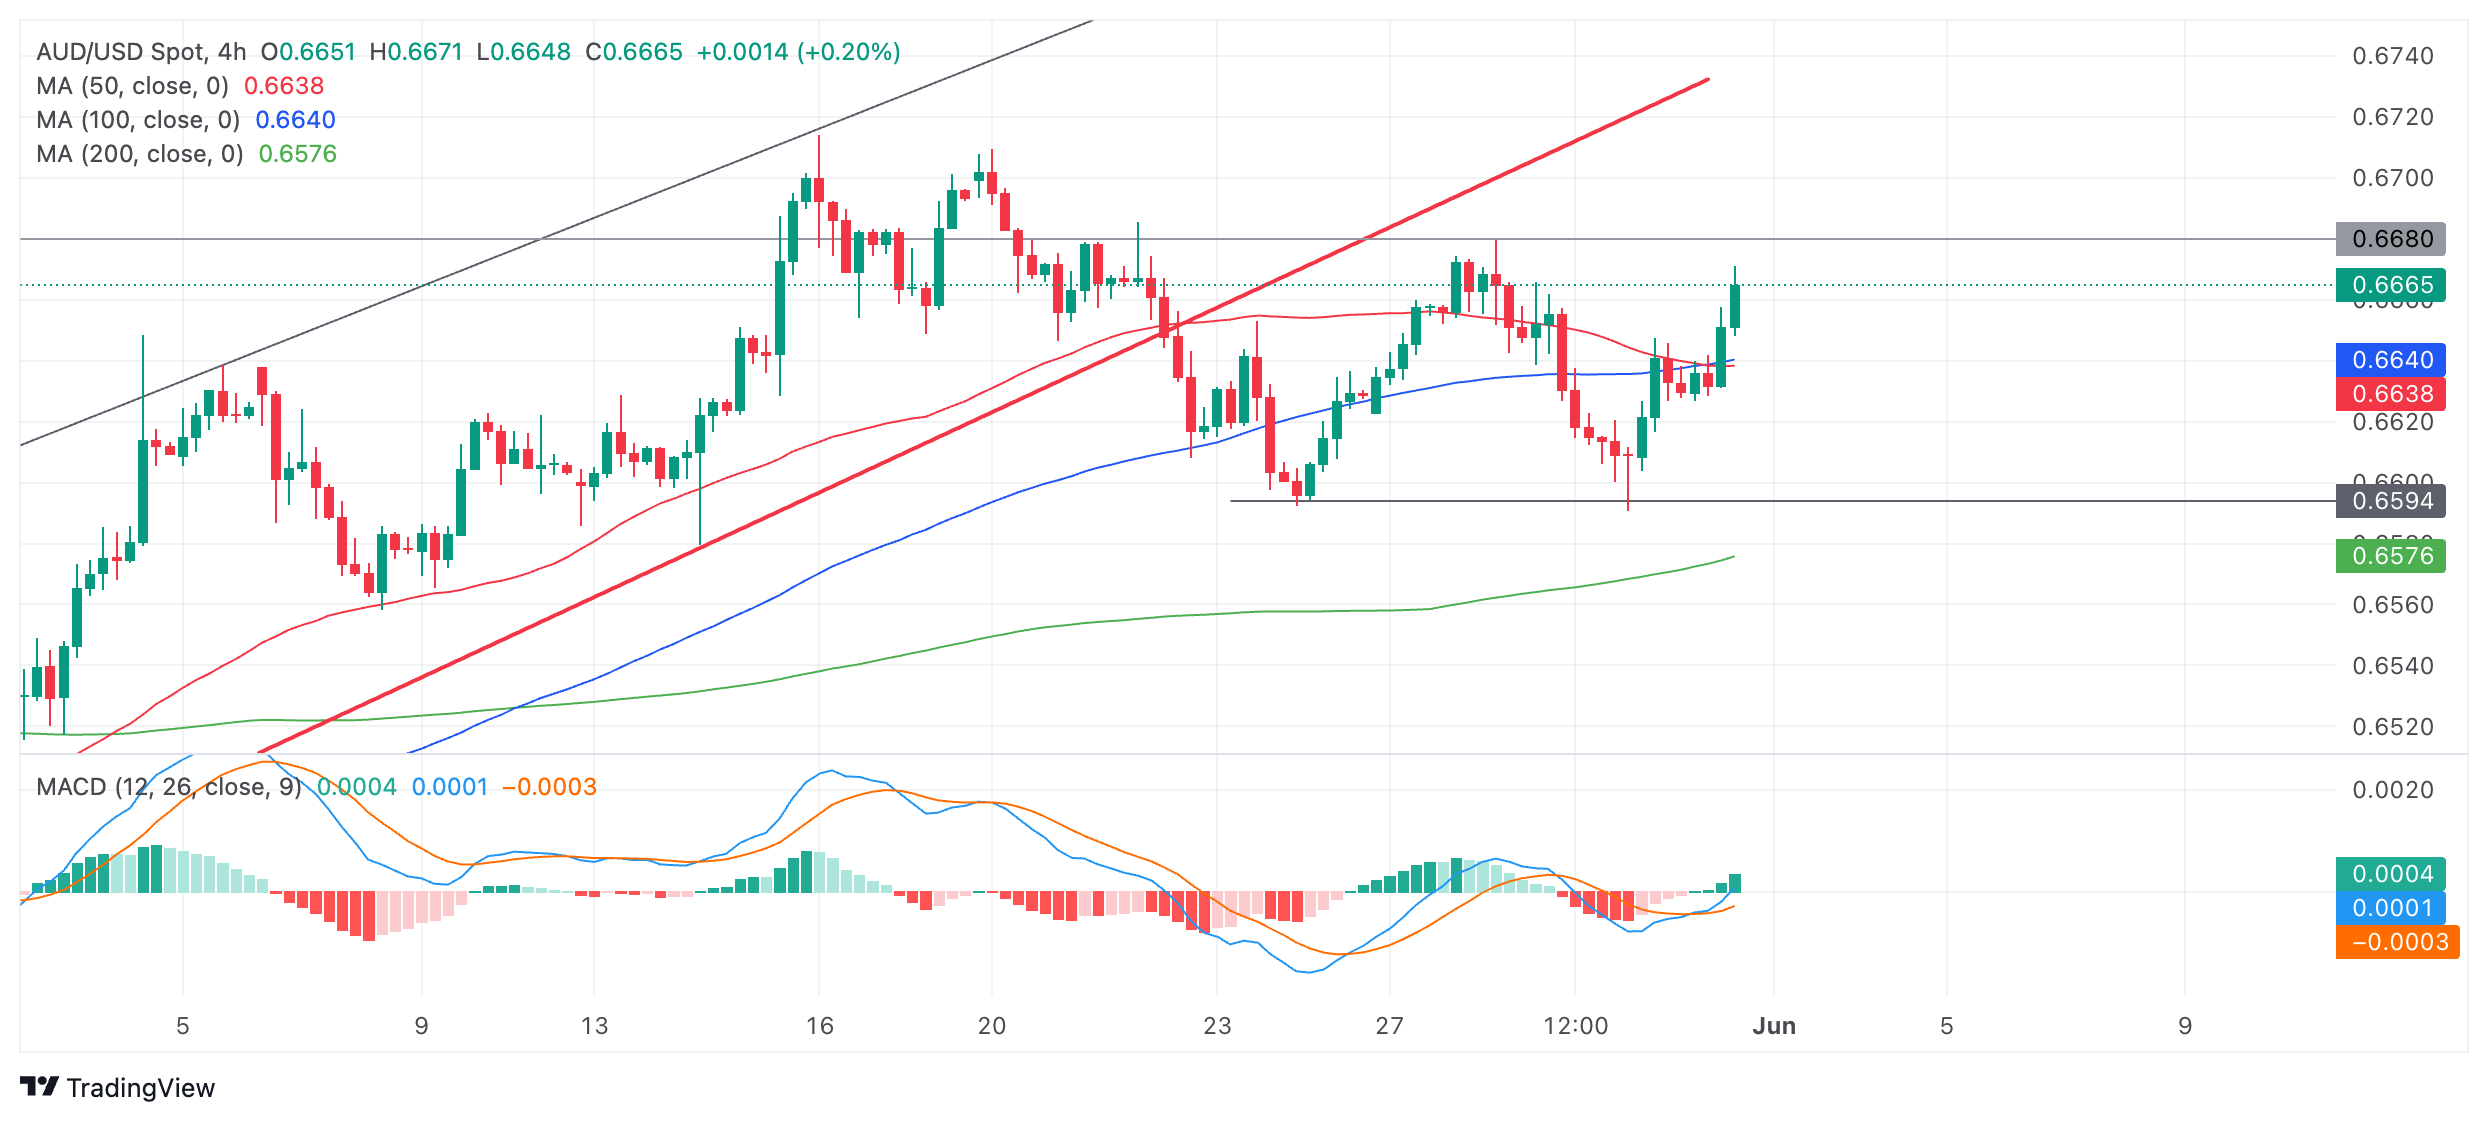
The current leg up within the range could reach the range ceiling at 0.6680 before reversing and starting a down leg to the range floor. 

The Moving Average Convergence Divergence (MACD) momentum indicator has crossed above its red signal line, giving a buy signal and supporting the move higher. 

If AUD/USD reaches the range highs or close to them and then rolls over and forms a Japanese candlestick reversal pattern it could be a sign the pair is extending its sideways trend and a leg down is about to begin. 

A MACD cross back below the signal line – especially if in positive territory – would add further evidence to suggest a move down within the narrow range was evolving. 

Failed breakdown

AUD/USD broke down from its rising channel on May 22, bringing the established uptrend into doubt. Follow-through lower was weak, however, and the pair soon found its feet. There is no clear short-term directional trend suggesting the trend may actually be sideways. 

It would require a decisive break below 0.6591 to confirm more downside, with the next target probably at 0.6560 where the 100 and 50-day SMAs are located (not shown). 

Alternatively, a decisive break above the range ceiling would reassert the bullish bias and probably lead to 0.6714 (May 14 high). 

Decisive breaks are accompanied by long candles that break through the level and close near their high or low or three consecutive candles that pierce the level in question and are all of the same color (red for a bearish decisive break and green for bullish). 


Disclaimer: For information purposes only. Past performance is not indicative of future results.
placeholder
Bitcoin slides deeper into red as bears lean on $96,600 wall and eye $90,000Bitcoin extends its decline after failing to reclaim $96,500, trading below $95,000, the 100-hour SMA and a bearish trend line near $96,600; unless bulls can force a decisive close back above $96,600–$97,200, the short-term path of least resistance stays lower, with $92,500, $90,000 and the main $88,500 support zone in focus.
Author  Mitrade
Nov 17, Mon
Bitcoin extends its decline after failing to reclaim $96,500, trading below $95,000, the 100-hour SMA and a bearish trend line near $96,600; unless bulls can force a decisive close back above $96,600–$97,200, the short-term path of least resistance stays lower, with $92,500, $90,000 and the main $88,500 support zone in focus.
placeholder
Gold Price Forecast: XAU/USD declines below $4,050 on USD strength and hawkish Fed comments Gold price (XAU/USD) extends the decline to around $4,030 during the early Asian session on Tuesday. The precious metal edges lower as traders dialed back expectations of a US interest rate cut next month.
Author  FXStreet
Yesterday 01: 23
Gold price (XAU/USD) extends the decline to around $4,030 during the early Asian session on Tuesday. The precious metal edges lower as traders dialed back expectations of a US interest rate cut next month.
placeholder
Ethereum Edges Toward Long-Term Holders’ Cost Basis, Now Only 8% Above Key Accumulation LevelEthereum is trading near $3,150 and just 8% above a key $2,895 long-term holders’ cost basis, with on-chain flows, macro uncertainty and support around $3,000–$2,800 all shaping what comes next for ETH.
Author  Mitrade
Yesterday 02: 28
Ethereum is trading near $3,150 and just 8% above a key $2,895 long-term holders’ cost basis, with on-chain flows, macro uncertainty and support around $3,000–$2,800 all shaping what comes next for ETH.
placeholder
Ethereum Dips Below $3,000: Is the Bull Market at an End?Ethereum's price plunged below $3,000 for the first time in four months, marking growing concerns of a potential end to the bull market.
Author  Mitrade
Yesterday 03: 34
Ethereum's price plunged below $3,000 for the first time in four months, marking growing concerns of a potential end to the bull market.
placeholder
Top 3 Price Prediction: Bitcoin, Ethereum, Ripple – BTC, ETH and XRP Look for a Foothold After a Sharp ShakeoutBitcoin trades near $92,600 after a dip below $90,000, while Ethereum around $3,118 and XRP near $2.21–$2.23 sit on key support zones, as BTC, ETH and XRP all try to turn a sharp correction into a tradable rebound rather than a deeper slide.
Author  Mitrade
5 hours ago
Bitcoin trades near $92,600 after a dip below $90,000, while Ethereum around $3,118 and XRP near $2.21–$2.23 sit on key support zones, as BTC, ETH and XRP all try to turn a sharp correction into a tradable rebound rather than a deeper slide.
goTop
quote