EUR/GBP gains momentum as EU inflation data tampers ECB dovish expectations

Source Fxstreet
  • EUR/GBP rose sharply on Friday at 0.8531, notching a 0.26% gain.
  • Inflation data from the Eurozone, both headline and core HICP, exceeded the forecasts.
  • A cut in June by the ECB seems already priced in, but hot inflation figures may impact the timing of the rest of the easing cycle.

The EUR/GBP pair is riding high on robust European Union (EU) inflation data, surpassing expectations and shifting market expectations away from the dovish view of the European Central Bank (ECB).

The inflation trend witnessed in the Eurozone is a critical driver currently dominating the FX markets, overriding the ECB's dovish undertone. Spain's HICP data further influenced the pair's gains, coming in a tick higher than expected at 3.8% YoY against the previous 3.4%. Germany's Harmonised rate, too, picked up to 2.8% YoY, outpacing April's 2.4%. Similarly, the EU’s block figures rose by 2.6% YoY for headline and 2.9% for the core measure both beating expectations.

These figures indicate unanticipated inflation pressures, potentially nudging the ECB to reconsider its dovish stance. In that sense, the talk in the next sessions will be on how aggressively the bank will take the easing cycle following a 25 bps cut already priced in June.

EUR/GBP technical analysis

In the daily analysis, the Relative Strength Index (RSI) hovers in negative territory, signifying considerable seller dominance over the past sessions. Furthermore, despite a slight rise from its near-oversold condition, the RSI still lingers below 50, indicating a possible continuing downward trend. The Moving Average Convergence Divergence (MACD) histogram reveals a series of decreasing red bars, implying a consistent negative momentum and validating the current bearish market sentiment.

EUR/GBP daily chart

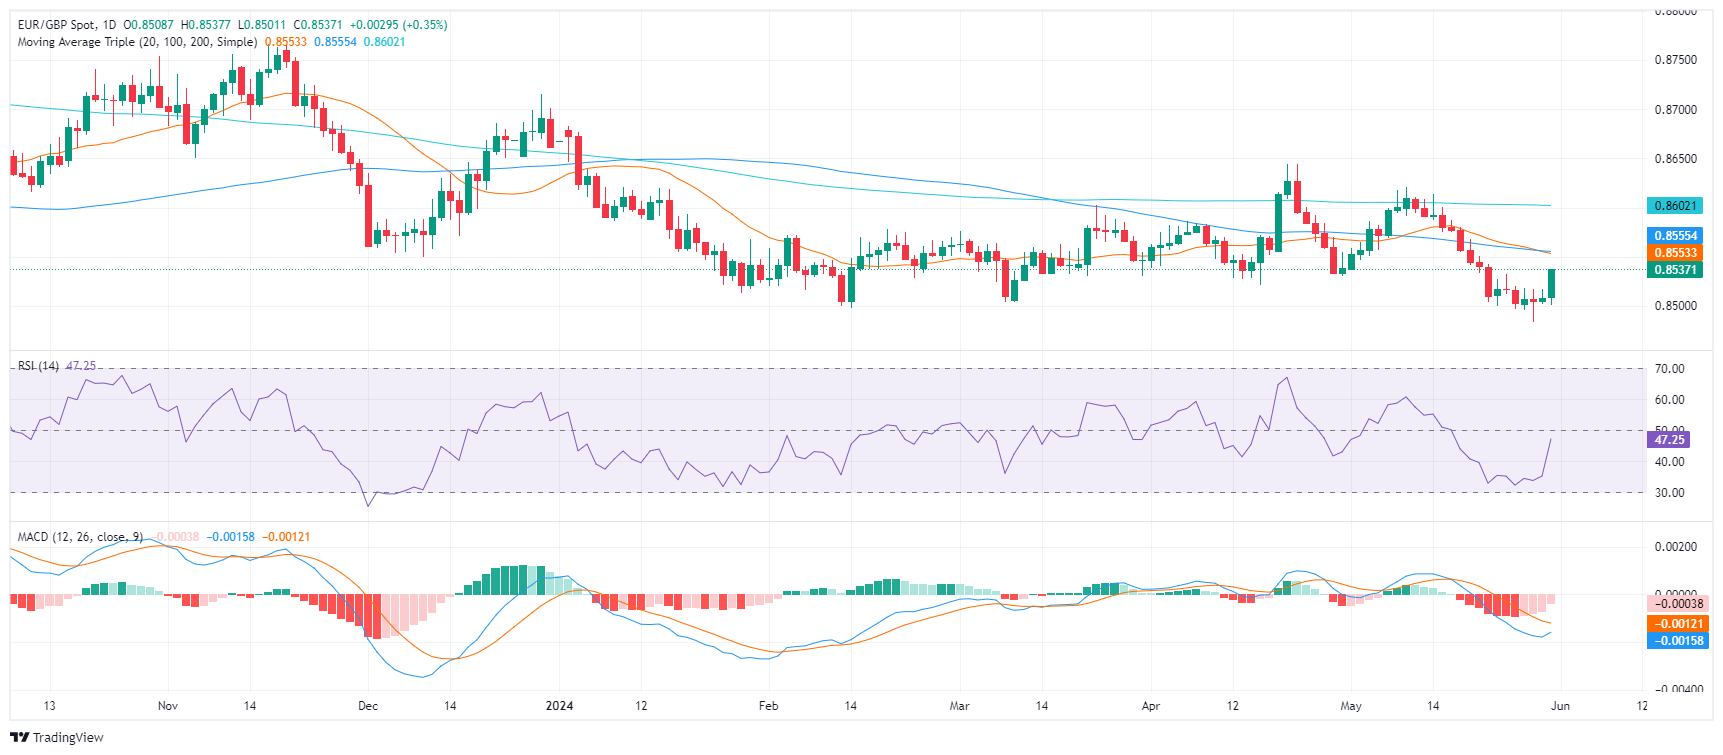
Adding to this bearish sentiment, the EUR/GBP is trading beneath three crucial Simple Moving Average (SMA) of the 20, 100, and 200-day. This positioning typically signals a bearish market condition, with further downward trends and potential additional price drops on the horizon.


EUR/GBP

Overview
Today last price 0.8537
Today Daily Change 0.0029
Today Daily Change % 0.34
Today daily open 0.8508
 
Trends
Daily SMA20 0.8555
Daily SMA50 0.8562
Daily SMA100 0.8556
Daily SMA200 0.8602
 
Levels
Previous Daily High 0.8517
Previous Daily Low 0.8502
Previous Weekly High 0.8568
Previous Weekly Low 0.85
Previous Monthly High 0.8645
Previous Monthly Low 0.8521
Daily Fibonacci 38.2% 0.8511
Daily Fibonacci 61.8% 0.8508
Daily Pivot Point S1 0.8501
Daily Pivot Point S2 0.8494
Daily Pivot Point S3 0.8485
Daily Pivot Point R1 0.8516
Daily Pivot Point R2 0.8524
Daily Pivot Point R3 0.8531


Disclaimer: For information purposes only. Past performance is not indicative of future results.
placeholder
Gold Price Forecast: XAU/USD drifts higher above $4,200 as Fed delivers expected cutGold price (XAU/USD) gains momentum to around $4,235 during the early Asian session on Thursday. The precious metal extends its upside after the US Federal Reserve (Fed) delivered an expected third consecutive interest rate cut and maintained its outlook for just one cut in 2026.
Author  FXStreet
Dec 11, Thu
Gold price (XAU/USD) gains momentum to around $4,235 during the early Asian session on Thursday. The precious metal extends its upside after the US Federal Reserve (Fed) delivered an expected third consecutive interest rate cut and maintained its outlook for just one cut in 2026.
placeholder
Gold remains bid as lack of Fed clarity and geopolitical frictions persistGold (XAU/USD) advances modestly on Friday as traders seem to book profits ahead of the weekend, yet clings to gains of over 0.51% after reaching a seven-week high of $4,353. At the time of writing, XAU/USD trades at $4,302 as traders digest comments from Federal Reserve (Fed) officials.
Author  FXStreet
Yesterday 01: 34
Gold (XAU/USD) advances modestly on Friday as traders seem to book profits ahead of the weekend, yet clings to gains of over 0.51% after reaching a seven-week high of $4,353. At the time of writing, XAU/USD trades at $4,302 as traders digest comments from Federal Reserve (Fed) officials.
placeholder
Ethereum Price Slips Lower — $3,000 Looms as the Key BattlegroundEthereum is attempting to recover from a $3,026 low but remains below $3,200 and the 100-hour SMA, with a bearish trend line near $3,175 capping rebounds as bulls need a clean break above $3,200 to target $3,250–$3,400, while a drop below $3,050 risks a retest of $3,000 and $2,940.
Author  Mitrade
Yesterday 03: 25
Ethereum is attempting to recover from a $3,026 low but remains below $3,200 and the 100-hour SMA, with a bearish trend line near $3,175 capping rebounds as bulls need a clean break above $3,200 to target $3,250–$3,400, while a drop below $3,050 risks a retest of $3,000 and $2,940.
placeholder
Macro Analysts: Hawkish Japan Could Push Bitcoin Below $70KAnalysts predict Bitcoin may face further declines towards the $70,000 mark if the Bank of Japan raises interest rates as expected.
Author  Mitrade
Yesterday 05: 48
Analysts predict Bitcoin may face further declines towards the $70,000 mark if the Bank of Japan raises interest rates as expected.
placeholder
Bitcoin Slides 5% as Sellers Lean In — Can BTC Reclaim $88,000?Bitcoin has dropped back below $88,000 after rolling over from $90,500, with price still trading under the 100-hour Simple Moving Average. The sell-off found a floor at $85,151, and BTC is now consolidating near that base, but rebounds are facing pressure from a bearish trend line around $89,000. Bulls need to retake $88,000–$89,000 to ease downside risk; failure to do so keeps $85,500–$85,000 and then $83,500 in play, with $80,000 as the deeper “line in the sand.” Bitcoin (BTC) is back in damage-control mode after a sharp pullback wiped out recent gains. The price failed to reclaim the $90,000–$90,500 band, rolled over, and slid through $88,500 before briefly dipping under $87,000. Buyers did show up around $85,000, but the rebound so far looks more like stabilization than a clear trend reversal. Bitcoin dips hard, finds a bid near $85,000(h3) BTC’s latest move lower began when it couldn’t build follow-through above $90,000 and $90,500. Once that upside stalled, sellers took control and pushed price down through $88,500. The slide accelerated enough to spike below $87,000, but the market didn’t free-fall. Bulls defended the $85,000 zone, printing a low at $85,151. Since then, Bitcoin has been consolidating below the 23.6% Fibonacci retracement of the drop from the $93,560 swing high to the $85,151 low — a clue that the bounce is still shallow and that sellers haven’t fully backed off yet. Structurally, BTC is still on the back foot: It’s trading below $88,000, and It remains below the 100-hour Simple Moving Average, keeping short-term trend pressure pointed downward. Resistance is layered, and $89,000 is the problem area(h3) If bulls try to turn this into a recovery, they’ll have to climb through multiple ceilings in quick succession. First, BTC faces resistance around $87,150, followed by a more meaningful barrier near $87,500. From there, the market’s attention snaps back to $88,000 — the level BTC just lost and now needs to reclaim. A close back above $88,000 would improve the tone, but it doesn’t solve the bigger issue: there’s a bearish trend line on the hourly BTC/USD chart (Kraken feed) with resistance near $89,000, which also lines up with the next technical hurdle. If BTC can push through $89,000 and hold, the rebound could extend toward $90,000, with follow-through targets at $91,000 and $91,500. But until price clears that $88,000–$89,000 zone, rallies are at risk of being sold rather than chased. If BTC fails to reclaim resistance, the downside path is clear(h3) The near-term bear case is simple: if Bitcoin can’t climb back above the $87,000 area and keep traction, sellers may attempt another leg lower. Support levels line up like this: Immediate support: $85,500 First major support: $85,000 Next support: $83,500 Then $82,500 in the near term Below that, the major “don’t break this” level is still $80,000. If BTC slips under $80,000, the risk of acceleration to the downside increases significantly — not because it’s magic, but because it’s the kind of psychological and structural level that tends to trigger forced de-risking. Indicators: momentum still leans bearish(h3) The intraday indicators aren’t offering much comfort yet: Hourly MACD is losing pace in the bearish zone. Hourly RSI remains below 50, suggesting sellers still have the upper hand on short timeframes. So while the $85,000 defense held for now, the market hasn’t flipped bullish — it’s just stopped bleeding.
Author  Mitrade
9 hours ago
Bitcoin has dropped back below $88,000 after rolling over from $90,500, with price still trading under the 100-hour Simple Moving Average. The sell-off found a floor at $85,151, and BTC is now consolidating near that base, but rebounds are facing pressure from a bearish trend line around $89,000. Bulls need to retake $88,000–$89,000 to ease downside risk; failure to do so keeps $85,500–$85,000 and then $83,500 in play, with $80,000 as the deeper “line in the sand.” Bitcoin (BTC) is back in damage-control mode after a sharp pullback wiped out recent gains. The price failed to reclaim the $90,000–$90,500 band, rolled over, and slid through $88,500 before briefly dipping under $87,000. Buyers did show up around $85,000, but the rebound so far looks more like stabilization than a clear trend reversal. Bitcoin dips hard, finds a bid near $85,000(h3) BTC’s latest move lower began when it couldn’t build follow-through above $90,000 and $90,500. Once that upside stalled, sellers took control and pushed price down through $88,500. The slide accelerated enough to spike below $87,000, but the market didn’t free-fall. Bulls defended the $85,000 zone, printing a low at $85,151. Since then, Bitcoin has been consolidating below the 23.6% Fibonacci retracement of the drop from the $93,560 swing high to the $85,151 low — a clue that the bounce is still shallow and that sellers haven’t fully backed off yet. Structurally, BTC is still on the back foot: It’s trading below $88,000, and It remains below the 100-hour Simple Moving Average, keeping short-term trend pressure pointed downward. Resistance is layered, and $89,000 is the problem area(h3) If bulls try to turn this into a recovery, they’ll have to climb through multiple ceilings in quick succession. First, BTC faces resistance around $87,150, followed by a more meaningful barrier near $87,500. From there, the market’s attention snaps back to $88,000 — the level BTC just lost and now needs to reclaim. A close back above $88,000 would improve the tone, but it doesn’t solve the bigger issue: there’s a bearish trend line on the hourly BTC/USD chart (Kraken feed) with resistance near $89,000, which also lines up with the next technical hurdle. If BTC can push through $89,000 and hold, the rebound could extend toward $90,000, with follow-through targets at $91,000 and $91,500. But until price clears that $88,000–$89,000 zone, rallies are at risk of being sold rather than chased. If BTC fails to reclaim resistance, the downside path is clear(h3) The near-term bear case is simple: if Bitcoin can’t climb back above the $87,000 area and keep traction, sellers may attempt another leg lower. Support levels line up like this: Immediate support: $85,500 First major support: $85,000 Next support: $83,500 Then $82,500 in the near term Below that, the major “don’t break this” level is still $80,000. If BTC slips under $80,000, the risk of acceleration to the downside increases significantly — not because it’s magic, but because it’s the kind of psychological and structural level that tends to trigger forced de-risking. Indicators: momentum still leans bearish(h3) The intraday indicators aren’t offering much comfort yet: Hourly MACD is losing pace in the bearish zone. Hourly RSI remains below 50, suggesting sellers still have the upper hand on short timeframes. So while the $85,000 defense held for now, the market hasn’t flipped bullish — it’s just stopped bleeding.
goTop
quote