

EUR/USD hamstrung in the midrange ahead of Friday full of key data
- EUR/USD recovered into familiar technical levels after a dip to 1.0790.
- Investor appetite is testing higher after US data teased slowing growth.
- Friday brings a full docket with EU HICP inflation and US PCE inflation.
EUR/USD dipped to 1.0790 on Thursday before a broad-market recovery forced the Greenback lower across the board. US Gross Domestic Product (GDP) growth eased in-line with market expectations, and rate-cut-hopeful investors are taking a cautious step forward ahead of Friday’s key data prints.
Friday brings a fresh print of pan-European Harmonized Index of Consumer Prices (HICP) inflation. May’s YoY Core EU HICP inflation is expected to tick higher to 2.8% from 2.7%, with headline HICP inflation also expected to rise 2.5% YoY versus the previous 2.4%.
Key US data will follow-up later Friday, with US Core Personal Consumption Expenditure (PCE) Price Index inflation due during the American market session. Median market forecasts expect Core PCE Price Index inflation to hold steady at 2.8% for the year ended in April, with MoM Core PCE Price Index inflation forecast to hold at 0.3%.
US GDP growth eased to 1.3% in the first quarter from the previous 1.6%, matching market forecasts and sending broad-market hopes for a Federal Reserve (Fed) rate cut. According to the CME’s FedWatch Tool, rate traders are pricing in higher odds of a rate trim from the Federal Open Market Committee (FOMC) in September. At current cut, rate markets are betting there is only a 49% chance of the FOMC holding steady on rates in September, with over 50% odds of at least a quarter-point cut.
EUR/USD technical outlook
EUR/USD caught a bounce to 1.0840 on Thursday after an early dip to 1.0790. The pair is strung in the middle of a rough sideways grind with the midpoint at the 200-hour Exponential Moving Average (EMA) near 1.0835.
Daily candlesticks caught a bounce from the 200-day EMA at 1.0805, but technical support remains thin as the 50-day EMA consolidates with the long-term moving average. EUR/USD is up from April’s swing low into the 1.0600 handle, but still remains down from 2024’s January peak of 1.1045.
EUR/USD hourly chart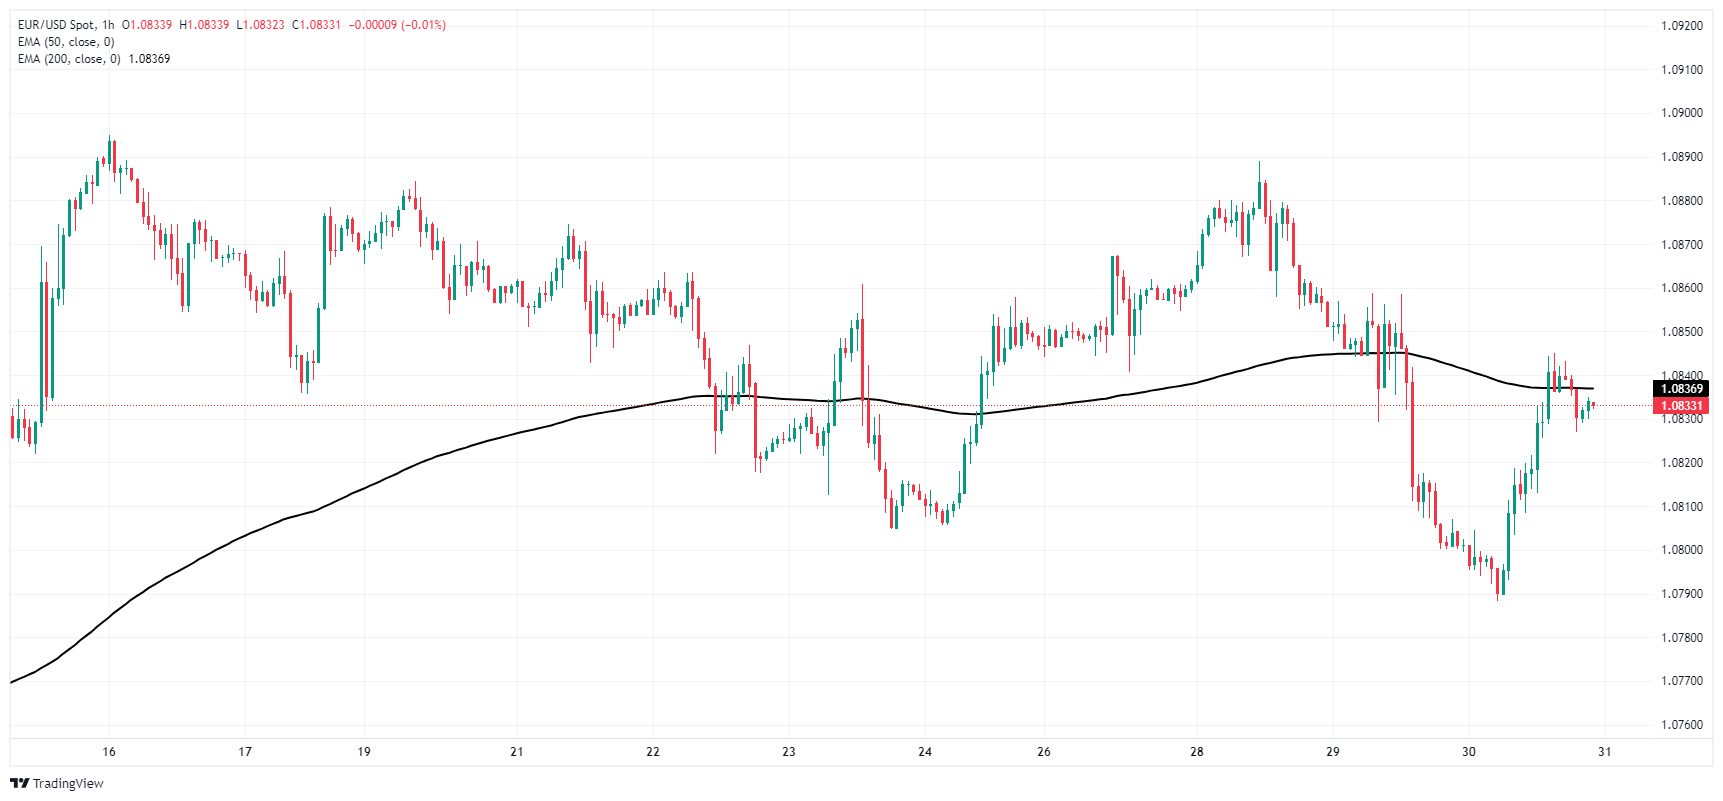
EUR/USD daily chart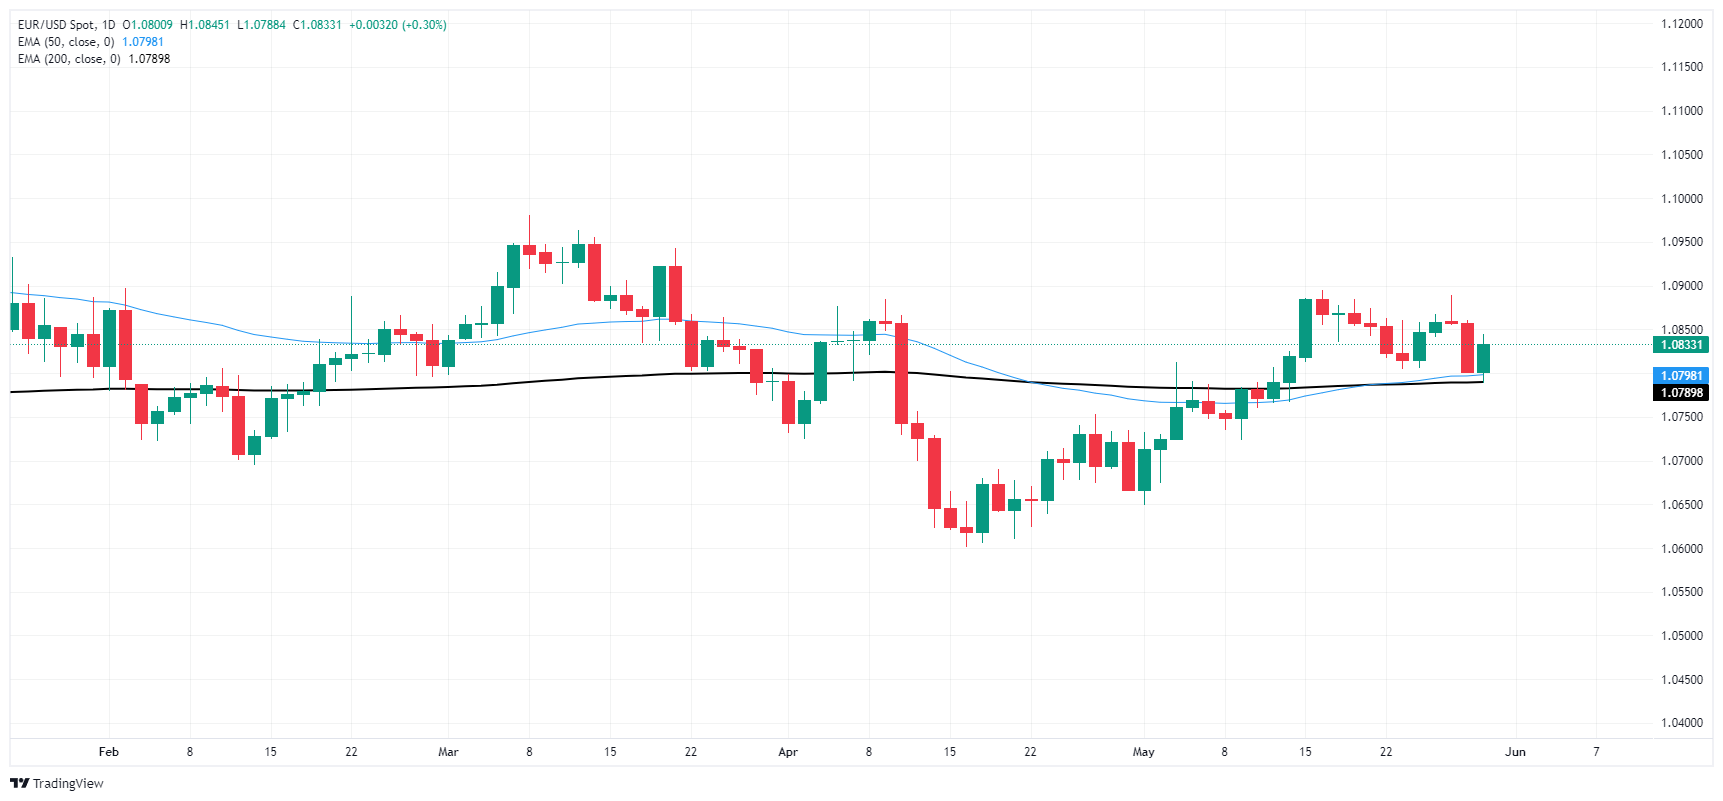
Recommended Articles


