GBP/USD Price Analysis: Recovers above 1.2700 amid soft US Dollar

Source Fxstreet
  • GBP/USD bounces back off weekly lows around 1.2680.
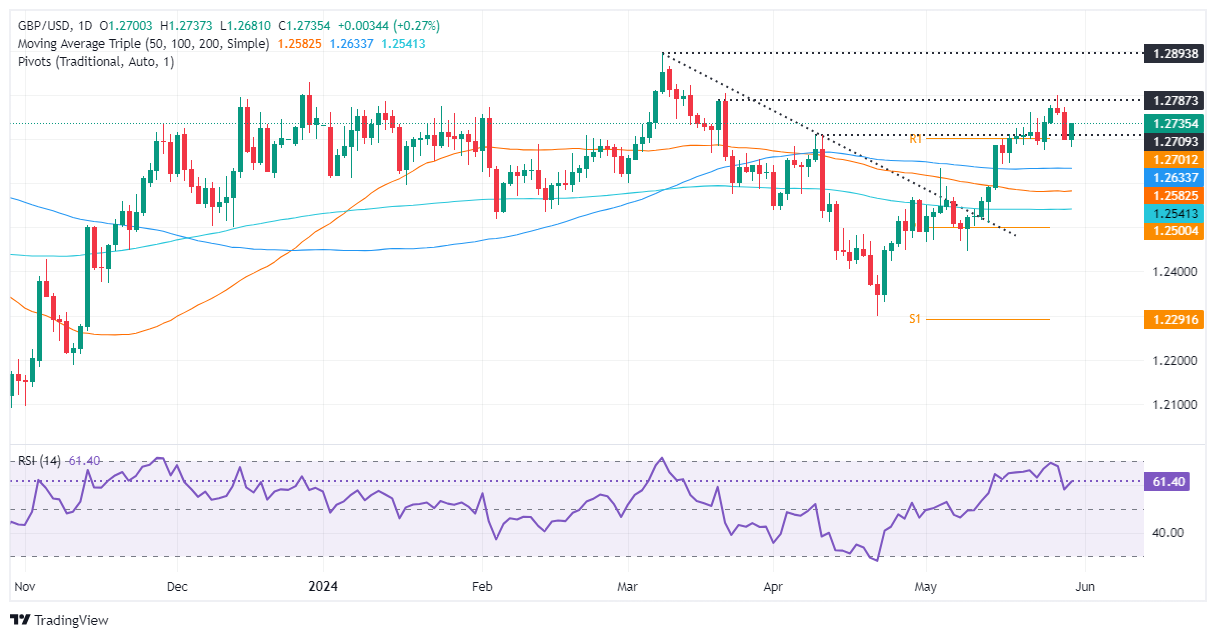
  • Technical outlook shows neutral to upward bias, with key resistance at 1.2803.
  • Critical support levels include May 24 low at 1.2674 and the 50-DMA at 1.2581.

The Pound Sterling recovered some ground against the US Dollar on Thursday, as US Treasury yields are sliding, undermining the Greenback. Consequently, the GBP/USD bounced off weekly lows, reached 1.2680, and traded at 1.2728, gaining 0.20%.

GBP/USD Price Analysis: Technical outlook

The daily chart suggests the GBP/USD is neutral to upward bias, but the buyer's failure to crack the March 21 daily high at 1.2803 opened the door for a pullback. Although momentum remains bullish, as shown by the Relative Strength Index (RSI), buying pressure begins to fade after testing 1.2800.

For a bullish continuation, the GBP/USD needs to surpass 1.2803. That would sponsor a rally to the year-to-date (YTD) high of 1.2893, followed by 1.2900. Overhead resistance lies ahead, with 1.3000 seen as a crucial resistance.

Conversely, if sellers move in decisively and push the major below 1.2700, further losses lie ahead. Key support levels would be tested. Initially, the May 24 low of 1.2674, followed by the 1.2600 mark. Down below, the 50-day moving average (DMA) at 1.2581 awaits.

GBP/USD Price Action – Daily Chart

GBP/USD

Overview
Today last price 1.273
Today Daily Change 0.0029
Today Daily Change % 0.23
Today daily open 1.2701
 
Trends
Daily SMA20 1.2635
Daily SMA50 1.2581
Daily SMA100 1.2634
Daily SMA200 1.2541
 
Levels
Previous Daily High 1.2772
Previous Daily Low 1.2699
Previous Weekly High 1.2761
Previous Weekly Low 1.2676
Previous Monthly High 1.2709
Previous Monthly Low 1.23
Daily Fibonacci 38.2% 1.2727
Daily Fibonacci 61.8% 1.2744
Daily Pivot Point S1 1.2676
Daily Pivot Point S2 1.2651
Daily Pivot Point S3 1.2604
Daily Pivot Point R1 1.2749
Daily Pivot Point R2 1.2797
Daily Pivot Point R3 1.2821


Disclaimer: For information purposes only. Past performance is not indicative of future results.
placeholder
The dollar weakened, equities dipped, and gold hit record highsThe dollar weakened, equities fell, and gold set new records on Wednesday as investors waited for a Fed rate cut later in the day.
Author  Cryptopolitan
Sep 17, 2025
The dollar weakened, equities fell, and gold set new records on Wednesday as investors waited for a Fed rate cut later in the day.
placeholder
ECB Policy Outlook for 2026: What It Could Mean for the Euro’s Next MoveWith the ECB likely holding rates steady at 2.15% and the Fed potentially extending cuts into 2026, EUR/USD may test 1.20 if Eurozone growth proves resilient, but weaker growth and an ECB pivot could pull the pair back toward 1.13 and potentially 1.10.
Author  Mitrade
Dec 26, 2025
With the ECB likely holding rates steady at 2.15% and the Fed potentially extending cuts into 2026, EUR/USD may test 1.20 if Eurozone growth proves resilient, but weaker growth and an ECB pivot could pull the pair back toward 1.13 and potentially 1.10.
placeholder
Silver Price Forecast: XAG/USD consolidates above $79.00; bearish bias intact ahead of FedSilver (XAG/USD) lacks a firm intraday direction and oscillates in a narrow range during the Asian session on Wednesday as traders opt to wait on the sidelines ahead of the crucial FOMC rate decision.
Author  FXStreet
Mar 18, Wed
Silver (XAG/USD) lacks a firm intraday direction and oscillates in a narrow range during the Asian session on Wednesday as traders opt to wait on the sidelines ahead of the crucial FOMC rate decision.
placeholder
Gold falls below $4,850 as Fed holds rates steadyGold price (XAU/USD) faces some selling pressure near $4,830 during the early Asian session on Thursday.
Author  FXStreet
Yesterday 01: 59
Gold price (XAU/USD) faces some selling pressure near $4,830 during the early Asian session on Thursday.
placeholder
Gold tumbles below $4,650 as inflation fears and liquidity squeeze weighGold price (XAU/USD) remains under selling pressure near $4,640 during the early Asian session on Friday. The precious metal extends the decline as soaring crude oil and energy prices, driven by the escalating US-Israeli war with Iran, reignite inflation fears.
Author  FXStreet
4 hours ago
Gold price (XAU/USD) remains under selling pressure near $4,640 during the early Asian session on Friday. The precious metal extends the decline as soaring crude oil and energy prices, driven by the escalating US-Israeli war with Iran, reignite inflation fears.
Related Instrument
goTop
quote