

NZD/USD drifts into the low side ahead of NZ 2024 budget release

Source Fxstreet
  • New Zealand prepares for the latest NZ government budget announcement.
  • NZ’s Fiscal Strategy Report will release alongside NZ’s updated budget.
  • Investors will keep an eye out for key US data to cap off the trading week.

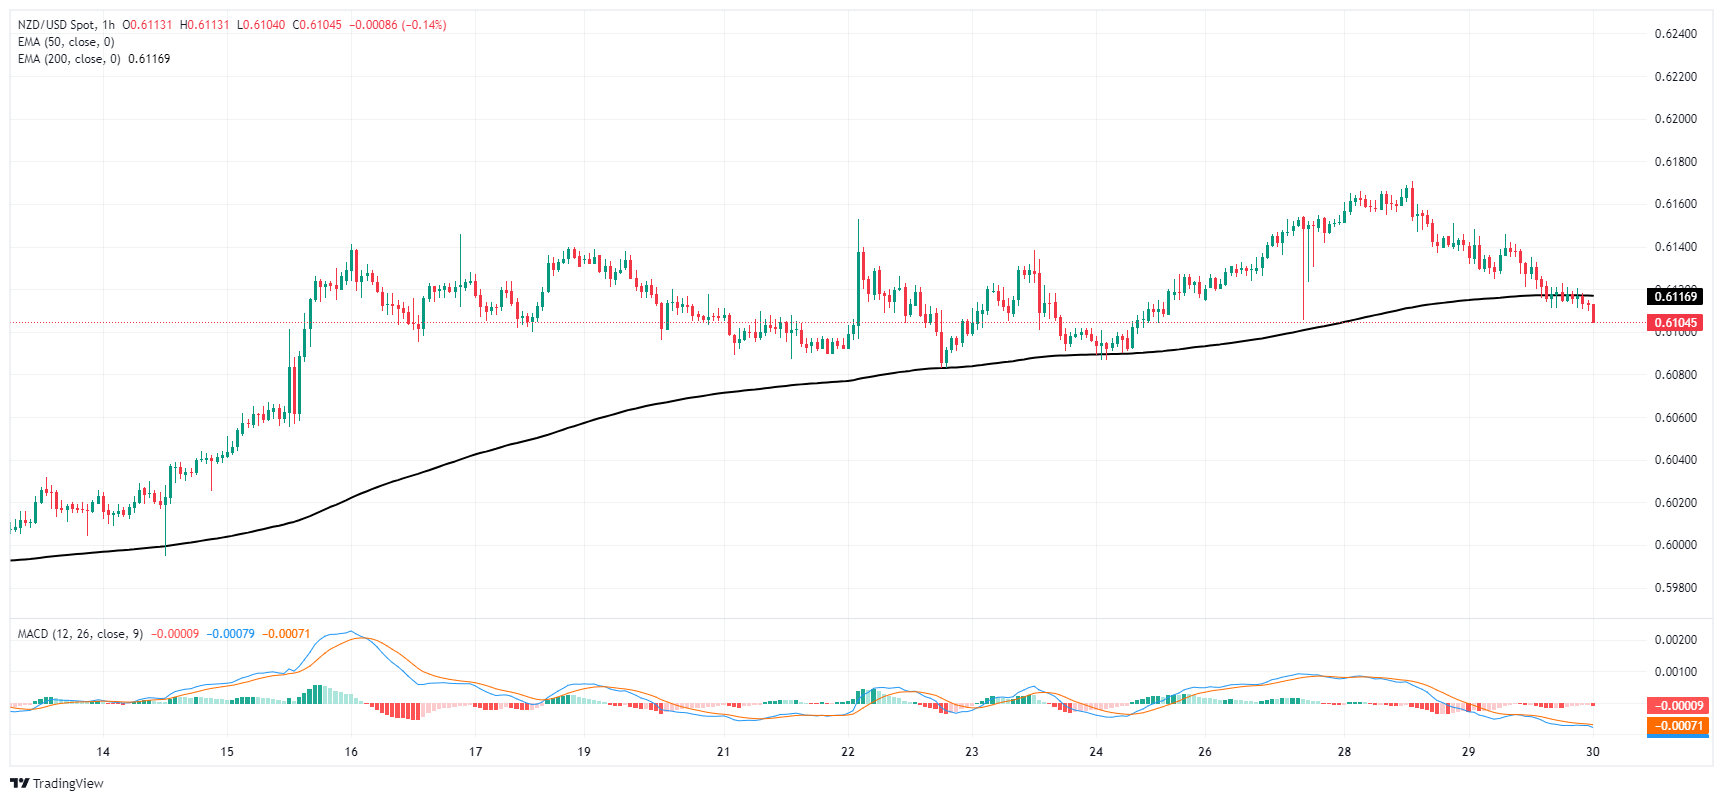
NZD/USD is on the soft side as markets pivot to Thursday’s early Pacific trading session, with the pair drifting into the 0.6100 region as the New Zealand government prepares to release its budget outline for the 2024 fiscal year alongside an updated Fiscal Strategy Report. New Zealand’s budget outline for 2024 will be announced by Minister of Finance Hon. Nicola Willis around 02:00 GMT.

According to analysts from Goldman Sachs, the NZD has been bolstered by a recent rise in dairy prices, but things could turn sour for the Kiwi if traders poke holes in the NZ government budget for 2024. Thursday’s joint budget and Financial Strategy Report follow up on the Budget Policy Statement for 2024 released in March.

Economic Indicator

Budget Release

Yearly New Zealand Bugdet Release is published by New Zealand Treasury.

Read more.

Next release: Thu May 30, 2024 02:00

Frequency: Irregular

Consensus: -

Previous: -

Source:

Looking ahead, Reserve Bank of New Zealand (RBNZ) Governor Orr will appear early Friday, and broader markets will pivot to face key US Gross Domestic Product (GDP) growth figures and US Personal Consumption Expenditures (PCE) Price Index inflation.

US Annualized Q1 GDP, slated for Thursday, is forecast to ease to 1.3% versus the previous print of 1.6%, and Core PCE Price Index inflation on Friday is expected to hold steady at 0.3% MoM in April. With investors desperate for signs of future rate cuts from the Federal Reserve (Fed), investors will be looking for signs of further easing in the US economy and cooling inflation figures. 

According to the CME’s FedWatch Tool, rate markets are pricing in slightly-worse-than-even odds of at least a quarter-point Fed rate trim in September, down sharply from the 70% odds that were priced in a week and a half ago. With the US economy still outperforming expectations, a still-tight labor market, and inflation still running hotter for longer than expected, rate-cut-hungry investors are hoping for signs of economic underperformance to bolster chances of at least two rate cuts in 2024 from the Fed.

NZD/USD technical outlook

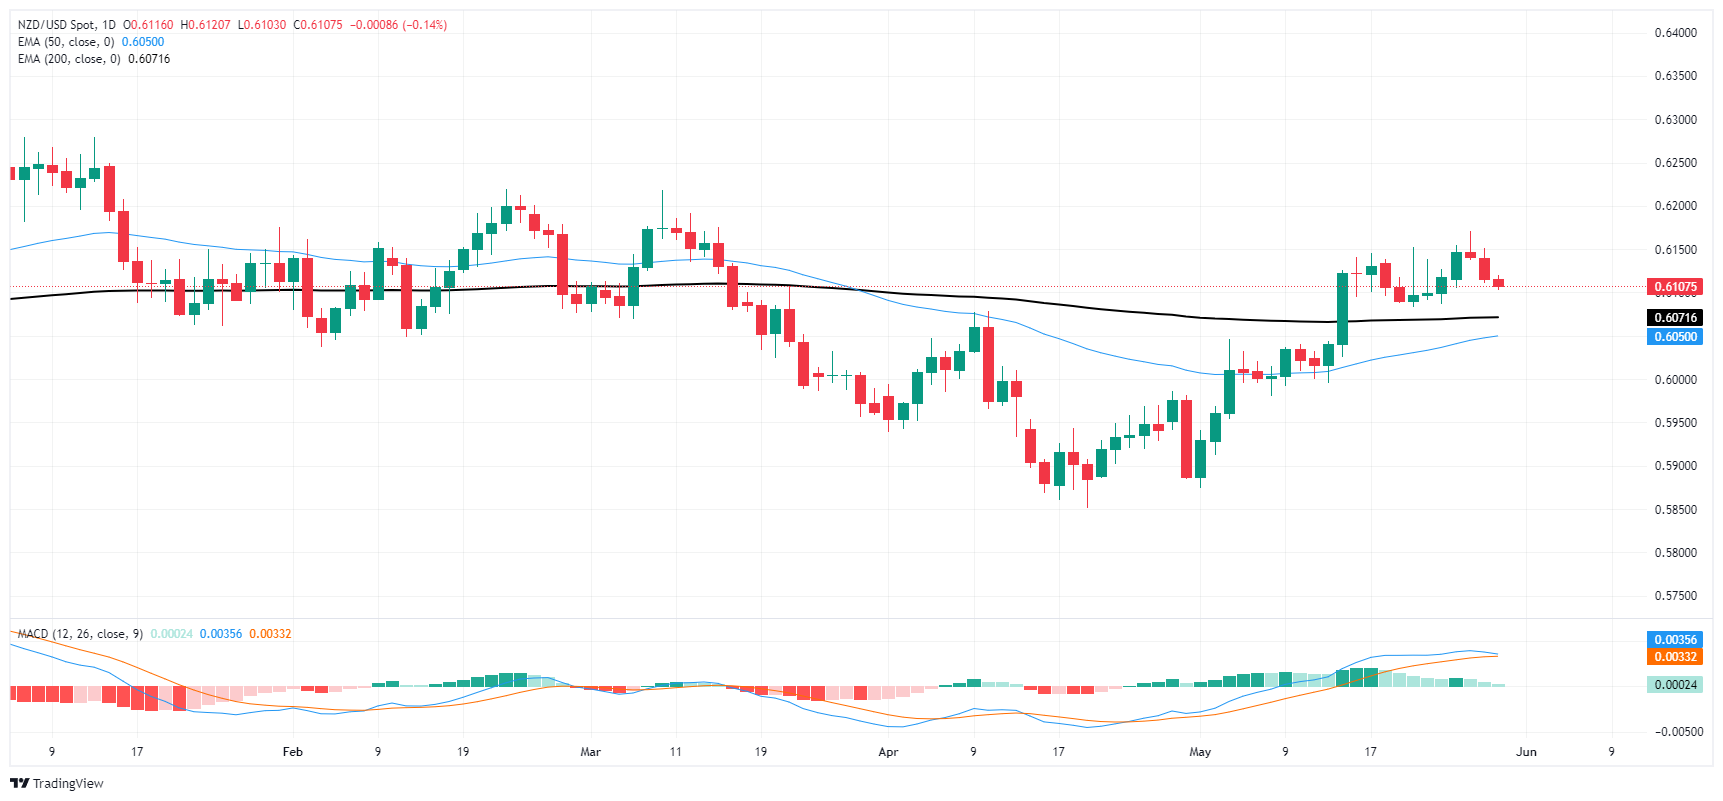
NZD/USD is trading down in the early Thursday market session, drifting towards the 0.6100 handle as broad-market Greeback strength forces down the Kiwi. The pair is heading lower for a third consecutive trading day, and bearish momentum will drag NZD/USD into the 200-day Exponential Moving Average (EMA) at 0.6077.

Despite near-term bearishness, the pair is still trading up from the last swing low into 0.5850 in April, and it’s buyers’ game to lose with the pair making little progress on the high side of key technical levels.

NZD/USD hourly chart
NZD/USD daily chart
NZD/USD

Overview
Today last price 0.6109
Today Daily Change -0.0007
Today Daily Change % -0.11
Today daily open 0.6116
 
Trends
Daily SMA20 0.6069
Daily SMA50 0.6007
Daily SMA100 0.6067
Daily SMA200 0.6046
 
Levels
Previous Daily High 0.6151
Previous Daily Low 0.6111
Previous Weekly High 0.6153
Previous Weekly Low 0.6083
Previous Monthly High 0.6079
Previous Monthly Low 0.5851
Daily Fibonacci 38.2% 0.6126
Daily Fibonacci 61.8% 0.6136
Daily Pivot Point S1 0.6101
Daily Pivot Point S2 0.6086
Daily Pivot Point S3 0.6061
Daily Pivot Point R1 0.6141
Daily Pivot Point R2 0.6166
Daily Pivot Point R3 0.6181


Disclaimer: For information purposes only. Past performance is not indicative of future results.
placeholder
US August CPI lands tonight: after a 5.4% PPI shock, will the Fed hike on September 16?US August PPI came in at 5.4% year-on-year, above the 5.3% consensus, with core PPI at 4.6%. Traders have pushed the odds of a 25bp Fed hike on September 15-16 to around 70%. Tonight's CPI is the last major inflation print before the decision — here is the full calendar, the consensus numbers, and what a hot versus cool reading would mean for the dollar, yields, gold and stocks.
Author  Irene Q.
Sep 11, Fri
US August PPI came in at 5.4% year-on-year, above the 5.3% consensus, with core PPI at 4.6%. Traders have pushed the odds of a 25bp Fed hike on September 15-16 to around 70%. Tonight's CPI is the last major inflation print before the decision — here is the full calendar, the consensus numbers, and what a hot versus cool reading would mean for the dollar, yields, gold and stocks.
placeholder
Brent tests $108 as a key export pipeline stays shut — can the rally clear $110?Brent crude rose 2.55% to $106.97 and WTI 2.32% to $102.30 as a major regional export pipeline remained offline with no restart timeline. Front-month backwardation has widened to $5.53 from $3.84 a week ago, European gas is at its highest since December 2022, and one analyst sees $119.48 if talks stall.
Author  Irene Q.
Sep 14, Mon
Brent crude rose 2.55% to $106.97 and WTI 2.32% to $102.30 as a major regional export pipeline remained offline with no restart timeline. Front-month backwardation has widened to $5.53 from $3.84 a week ago, European gas is at its highest since December 2022, and one analyst sees $119.48 if talks stall.
placeholder
Fed hike odds near 90% into Wednesday's decision — how to trade the dollar, gold and the S&P 500A 0.3% monthly core CPI print has lifted the market-implied probability of a 25bp Fed hike on 16 September to roughly 86.5% ~ 90%, which would be the first increase since July 2023. Here is the decision timeline, the pricing versus the forecasts, both scenarios, and the key levels for the dollar, gold and the S&P 500.
Author  Suzie
Sep 14, Mon
A 0.3% monthly core CPI print has lifted the market-implied probability of a 25bp Fed hike on 16 September to roughly 86.5% ~ 90%, which would be the first increase since July 2023. Here is the decision timeline, the pricing versus the forecasts, both scenarios, and the key levels for the dollar, gold and the S&P 500.
placeholder
Gold falls below $4,300 as higher US yields bolster Fed rate hike betsGold price (XAU/USD) tumbles to near $4,295 during the early Asian session on Tuesday. The precious metal faces some selling pressure as rising bond yields and surging energy prices strengthen expectations that the US Federal Reserve (Fed) will raise interest rates this week. 
Author  FXStreet
Yesterday 01: 23
Gold price (XAU/USD) tumbles to near $4,295 during the early Asian session on Tuesday. The precious metal faces some selling pressure as rising bond yields and surging energy prices strengthen expectations that the US Federal Reserve (Fed) will raise interest rates this week. 
placeholder
【Daily Brief】10-year Treasury yield briefly tops 5%, S&P 500 slips to 7,602 and the dollar firms at 99.3 as the Fed's decision eve beginsThe 10-year Treasury yield touched 5.014% on Monday — its first print above 5% since October 2023 — while the S&P 500 closed 0.48% lower at 7,619.98 and the dollar index firmed to 99.3. Here is the full market wrap ahead of Wednesday's FOMC decision, the dot plot and the August retail sales report, plus today's CLARITY Act Senate vote.
Author  Irene Q.
Yesterday 08: 16
The 10-year Treasury yield touched 5.014% on Monday — its first print above 5% since October 2023 — while the S&P 500 closed 0.48% lower at 7,619.98 and the dollar index firmed to 99.3. Here is the full market wrap ahead of Wednesday's FOMC decision, the dot plot and the August retail sales report, plus today's CLARITY Act Senate vote.
Related Instrument
goTop
quote