NZD/JPY Price Analysis: Bullish momentum adjusts, correction begins following overbought signals

Source Fxstreet
  • The daily chart continues to flash overbought signals despite a slight correction, with the overall uptrend still intact.
  • Despite a minor dip to 96.40, NZD/JPY remains near its multi-year peak.
  • The critical support level for the pair remains firmly at 95.00, marking a pivotal level to ward off losses.

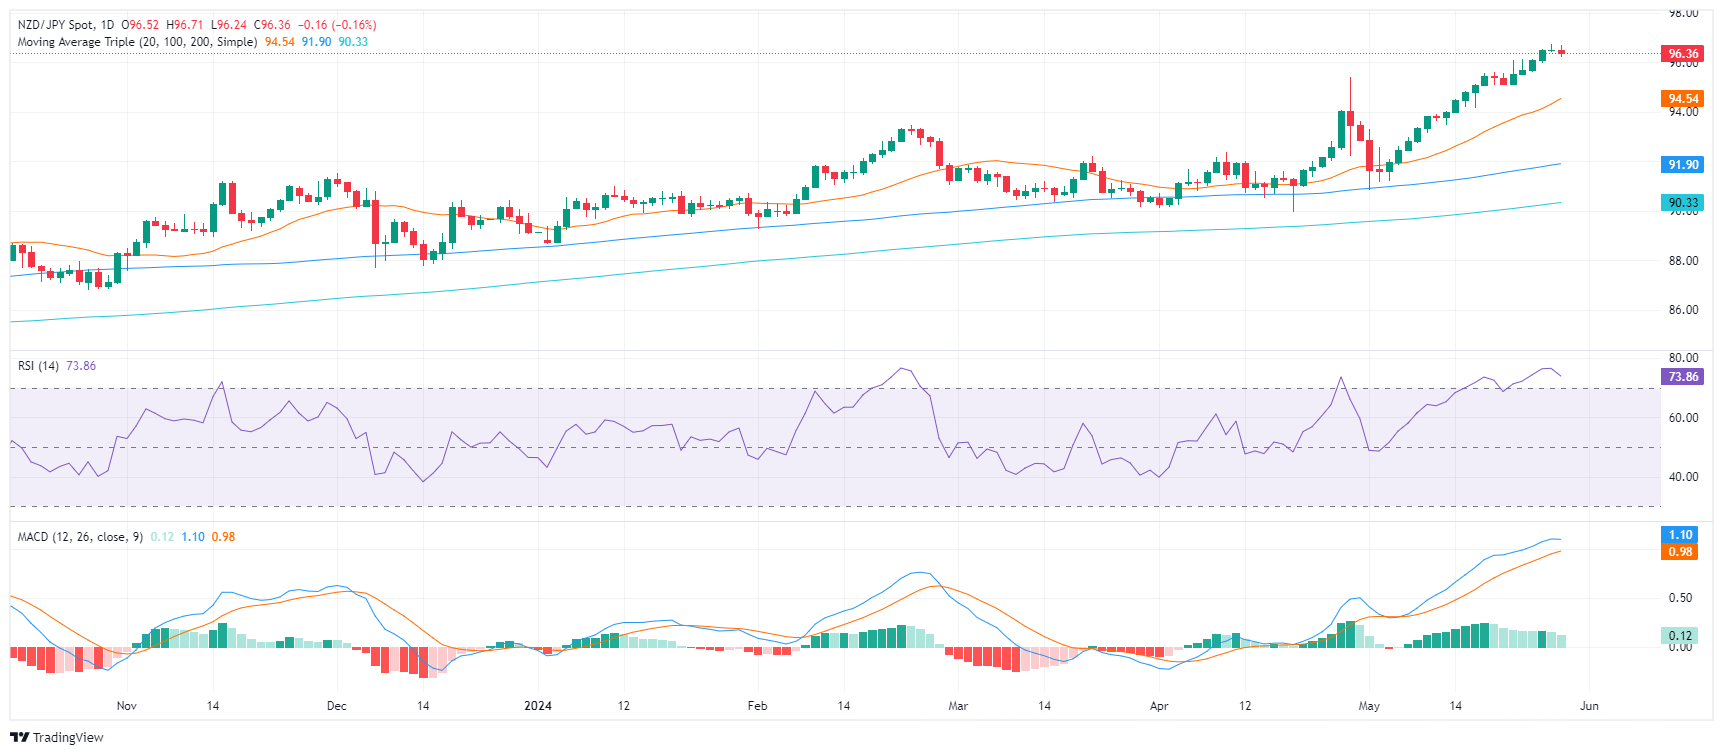
In Wednesday's session, the NZD/JPY pair saw a small correction to 96.40 but remains at its highest level since July 2007 at around 96.70. This adjustment doesn't quite alter the current outlook, merely turning it slightly cautious given the persistent overbought signals, but the overarching bullish trend carries on.

The daily chart's indicators confirm this narrative where the Relative Strength Index (RSI) remains in a deep overbought condition. Meanwhile, the Moving Average Convergence Divergence (MACD) keeps showing sustained positive momentum with its consistent green bars.

NZD/JPY daily chart
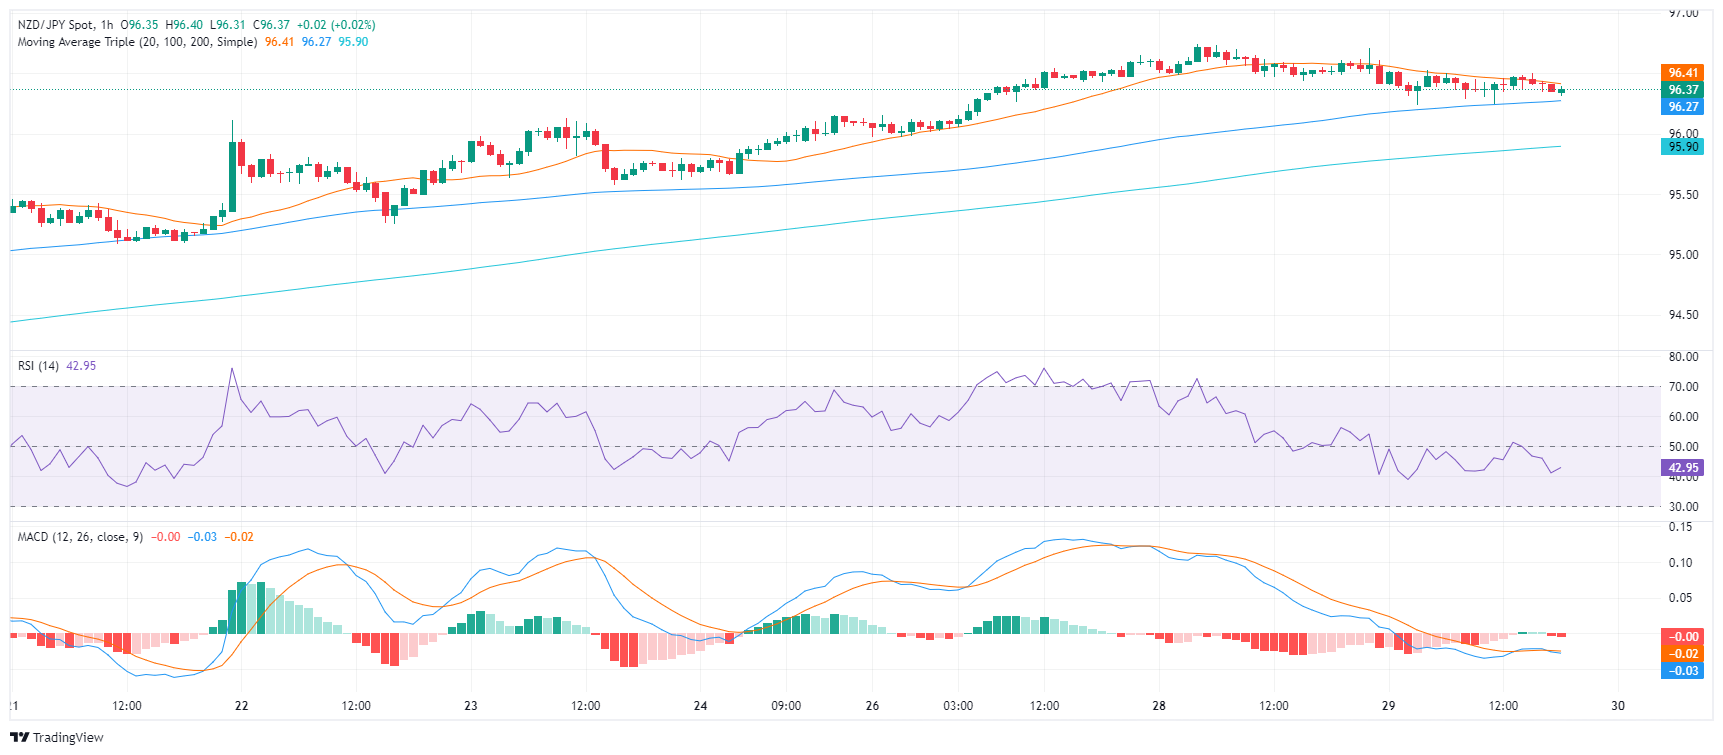
On the hourly chart, there is a visible weakening of strength compared to the daily perspective, and an ongoing edging downward can be observed.

NZD/JPY hourly chart
In a broader context, the NZD/JPY continues to display a strong uptrend, as shown by its position above the 20, 100, and 200-day Simple Moving Averages (SMA). Despite the slight correction, the pair's short-term gains still overshadow its medium and long-term averages.

As the looming correction gains momentum, any further downward movements should ideally keep the pair above its SMAs. Crucial to the monitoring is the first strong support level observed at 95.00, which the pair could potentially use to cushion any significant losses.


NZD/JPY

Overview
Today last price 96.35
Today Daily Change -0.17
Today Daily Change % -0.18
Today daily open 96.52
 
Trends
Daily SMA20 94.31
Daily SMA50 92.61
Daily SMA100 91.85
Daily SMA200 90.29
 
Levels
Previous Daily High 96.74
Previous Daily Low 96.43
Previous Weekly High 96.15
Previous Weekly Low 95.08
Previous Monthly High 95.42
Previous Monthly Low 89.96
Daily Fibonacci 38.2% 96.62
Daily Fibonacci 61.8% 96.55
Daily Pivot Point S1 96.39
Daily Pivot Point S2 96.25
Daily Pivot Point S3 96.08
Daily Pivot Point R1 96.7
Daily Pivot Point R2 96.88
Daily Pivot Point R3 97.01


Disclaimer: For information purposes only. Past performance is not indicative of future results.
placeholder
Ethereum Price Forecast: ETH tests $3,000 following strong ETF and treasury inflowsEthereum (ETH) climbed above $2,900 on Thursday, mimicking the rally seen in Bitcoin.
Author  FXStreet
Yesterday 01: 36
Ethereum (ETH) climbed above $2,900 on Thursday, mimicking the rally seen in Bitcoin.
placeholder
Bitcoin's surge to new all-time high sparks $1 billion in short liquidationsBitcoin (BTC) traded above 4% on Thursday after soaring to a new all-time high above $116,800. The rally, which appears to be leverage-driven, triggered over a $1 billion short-squeeze across the entire crypto market.
Author  FXStreet
Yesterday 03: 24
Bitcoin (BTC) traded above 4% on Thursday after soaring to a new all-time high above $116,800. The rally, which appears to be leverage-driven, triggered over a $1 billion short-squeeze across the entire crypto market.
placeholder
Japanese Yen dives back closer to weekly trough against a broadly firmer USDThe Japanese Yen (JPY) drifts lower against a broadly stronger US Dollar (USD) during the Asian session on Friday.
Author  FXStreet
Yesterday 03: 45
The Japanese Yen (JPY) drifts lower against a broadly stronger US Dollar (USD) during the Asian session on Friday.
placeholder
Dogecoin (DOGE) Rockets to $0.20 — Can It Go Even Higher?Dogecoin started a fresh increase above the $0.180 zone against the US Dollar.
Author  NewsBTC
21 hours ago
Dogecoin started a fresh increase above the $0.180 zone against the US Dollar.
placeholder
Gold price approaches weekly high as tariff jitters boost safe-haven demandGold price (XAU/USD) is gaining positive traction for the third consecutive day on Friday and approaching the top end of its weekly range amid rising trade tensions.
Author  FXStreet
21 hours ago
Gold price (XAU/USD) is gaining positive traction for the third consecutive day on Friday and approaching the top end of its weekly range amid rising trade tensions.
Related Instrument
goTop
quote