EUR/JPY Price Analysis: Consolidation phase imminent as bulls retreat

Source Fxstreet
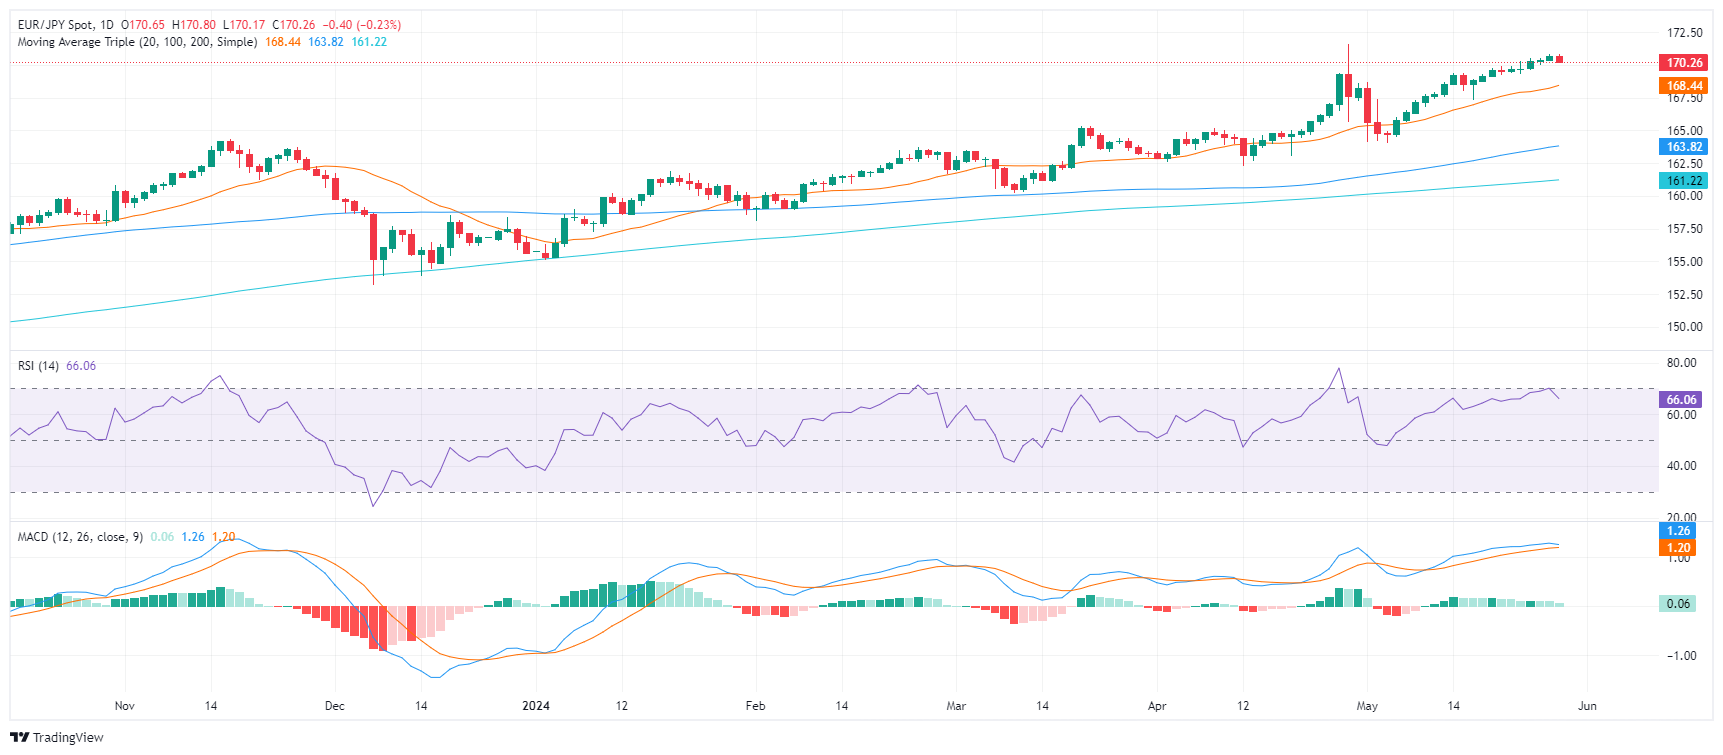
  • The daily RSI and MACD are edging downwards but remain in positive territory hinting at a possible consolidation phase that could be brief.
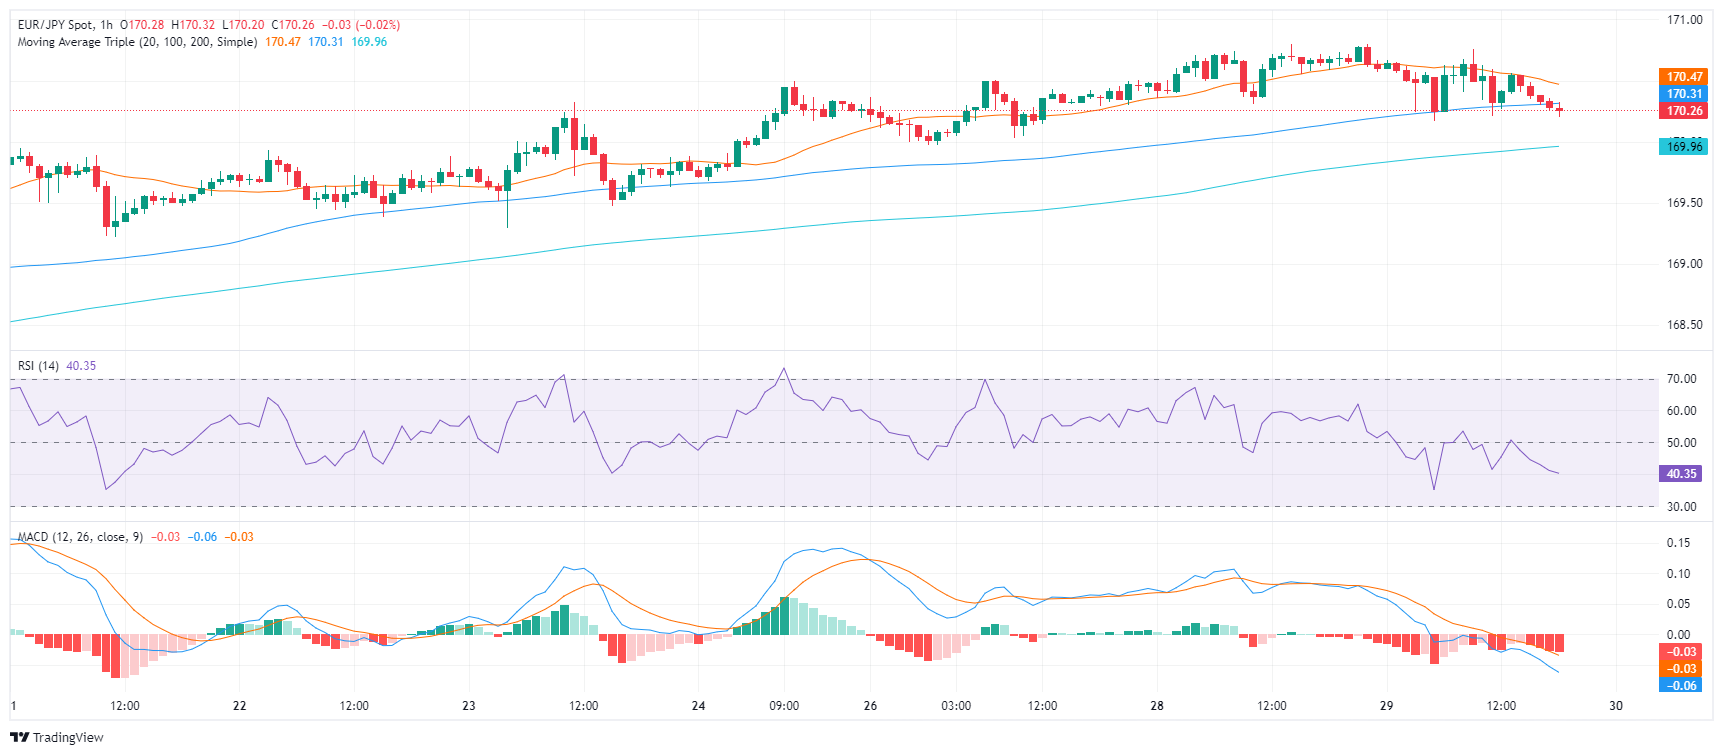
  • On the hourly chart, indicators have shifted into the negative zone, further pointing towards an ongoing correction phase.
  • The EUR/JPY's position above main SMAs keeps a long-term bullish sentiment alive despite the recent pullback.

In Wednesday's session, the EUR/JPY pair retreated slightly to 170.29, demonstrating an immediate dampening of the bullish momentum. However, since it remains close to cycle highs of 171.60, the consolidation period might not last long. Traders should observe the 170-168.00 range for potential correction movements before affirming changes to the outlook.

In the daily analysis, the Relative Strength Index (RSI) and the Moving Average Convergence Divergence (MACD) indicate a slight downward movement but still remain in the positive region. Both demonstrate the stopped short bullish trend which may lead to a short consolidation phase.

EUR/JPY daily chart

On the hourly chart, both RSI and MACD have now edged into the negative zone, corroborating with the indication of an ongoing corrective phase, which is likely response to recent gains.

EUR/JPY hourly chart

Notably, the current position of the EUR/JPY pair above the 20-day SMA at 168.45, though threatened, maintains the short-term bullish sentiment. Any movements below this could, however, fundamentally shift the bullish scenario. Below it, the 100 and 200-day SMA offer additional supportive barriers in case sellers come in strong.


EUR/JPY

Overview
Today last price 170.22
Today Daily Change -0.43
Today Daily Change % -0.25
Today daily open 170.65
 
Trends
Daily SMA20 168.21
Daily SMA50 166.17
Daily SMA100 163.71
Daily SMA200 161.16
 
Levels
Previous Daily High 170.8
Previous Daily Low 170.29
Previous Weekly High 170.5
Previous Weekly Low 169.05
Previous Monthly High 171.6
Previous Monthly Low 162.28
Daily Fibonacci 38.2% 170.6
Daily Fibonacci 61.8% 170.48
Daily Pivot Point S1 170.36
Daily Pivot Point S2 170.07
Daily Pivot Point S3 169.85
Daily Pivot Point R1 170.87
Daily Pivot Point R2 171.09
Daily Pivot Point R3 171.38


Disclaimer: For information purposes only. Past performance is not indicative of future results.
placeholder
When Will the Gold Dilemma Be Resolved? Breakdown of US-Iran Negotiations Puts Gold Prices Under Pressure Again, Can It Return to $5,000? Spot gold broke below the $4,700 level during the Asian trading session on May 11, dropping as low as $4,678. As of press time, it was trading at $4,670, in stark contrast to three days a
Author  TradingKey
8 hours ago
Spot gold broke below the $4,700 level during the Asian trading session on May 11, dropping as low as $4,678. As of press time, it was trading at $4,670, in stark contrast to three days a
placeholder
Hormuz Latest. Trump Rejects Iran Peace Plan; WTI Crude Hits $100 Again International oil prices surged in early Asian trading after U.S. President Trump and Iran rejected each other's latest long-term peace proposals. Both major crude oil futures rose by mor
Author  TradingKey
16 hours ago
International oil prices surged in early Asian trading after U.S. President Trump and Iran rejected each other's latest long-term peace proposals. Both major crude oil futures rose by mor
placeholder
Gold slumps below $4,700 on Trump rejection of Iran peace proposalGold price (XAU/USD) falls to around $4,690 during the early Asian session on Monday. The precious metal attracts some sellers after US President Donald Trump rejected Iran’s latest peace offer to end the 10-week conflict choking the Strait of Hormuz, fanning inflation fears. 
Author  FXStreet
17 hours ago
Gold price (XAU/USD) falls to around $4,690 during the early Asian session on Monday. The precious metal attracts some sellers after US President Donald Trump rejected Iran’s latest peace offer to end the 10-week conflict choking the Strait of Hormuz, fanning inflation fears. 
placeholder
Silver Price Analysis: Climbs above $80, as bulls eye weekly highSilver price advances more than 2.50% on Friday, set to end the week with gains of over 7% sponsored by US Dollar weakness and falling oil prices. At the time of writing, the XAG/USD trades at $80.72, after bouncing off daily lows of $78.16.
Author  FXStreet
May 09, Sat
Silver price advances more than 2.50% on Friday, set to end the week with gains of over 7% sponsored by US Dollar weakness and falling oil prices. At the time of writing, the XAG/USD trades at $80.72, after bouncing off daily lows of $78.16.
placeholder
April NFP Lands at 8:30 AM Today — 65K Forecast, a New Fed Chair, and the Dollar at Triple-Bottom SupportApril 2026 NFP forecast 62K–70K vs March 178K. Unemployment expected 4.3%. Fed on hold at 3.50–3.75% with Kevin Warsh as new chair. DXY triple-bottom at $97.69. Trade setup inside.The Apr
Author  TradingKey
May 08, Fri
April 2026 NFP forecast 62K–70K vs March 178K. Unemployment expected 4.3%. Fed on hold at 3.50–3.75% with Kevin Warsh as new chair. DXY triple-bottom at $97.69. Trade setup inside.The Apr
Related Instrument
goTop
quote