

EUR/USD treads water near 1.0860 as markets gear up for another week of Fed-watching
- EUR/USD found little gains against the weaker Greenback.
- European economic data thin this week, US PCE inflation key print.
- US GDP, Fedspeak to feature prominently this week.
EUR/USD found little momentum on Monday, cycling near 1.0860 after US markets were dark for the holiday long weekend. Tuesday will kick off the Fiber’s trading week in earnest after German sentiment surveys hobbled the Euro (EUR) on Monday.
Talking points from central planners on both sides of the Atlantic are spread throughout this week. The European Central Bank (ECB) is all but guaranteed to cut interest rates in June, while cut-hungry traders continue to search for signs of a rate trim from the Federal Reserve (Fed). According to the CME’s FedWatch Tool, markets are pricing in nearly-even odds of a quarter-point rate cut from the Fed in September, down significantly from over 70% a week ago.
German Consumer Price Index (CPI) inflation figures are slated for Wednesday, and markets are expecting Germany’s economy to grow by only 0.2% MoM in May compared to the previous 0.5%.
The US will dominate the latter half of the economic calendar this week, with US Gross Domestic Product (GDP) due on Thursday, and Personal Consumption Expenditure (PCE) Price Index inflation figures slated for Friday. US Q1 GDP is expected to ease to 1.4% versus 1.6%, and investors are hoping that PCE Price Index inflation will hold steady at 0.3% MoM in April.
German Retail Sales and pan-European Harmonized Index of Consumer Prices (HICP) are both due on Friday. German Retail Sales last grow 0.3% YoY in April, while Core European HICP inflation is expected to hold steady at 2.7% YoY in May.
EUR/USD technical outlook
EUR/USD has recovered from a near-term decline into the 1.0800 region, but topside momentum remains thin and the pair is grappling with a pileup of technical resistance below the 1.0900 handle.
Despite recent losses, EUR/USD remains on the high side of the 200-day Exponential Moving Average (EMA) at 1.0790. However the pair still remains down from 2024’s opening bids near 1.1036.
EUR/USD hourly chart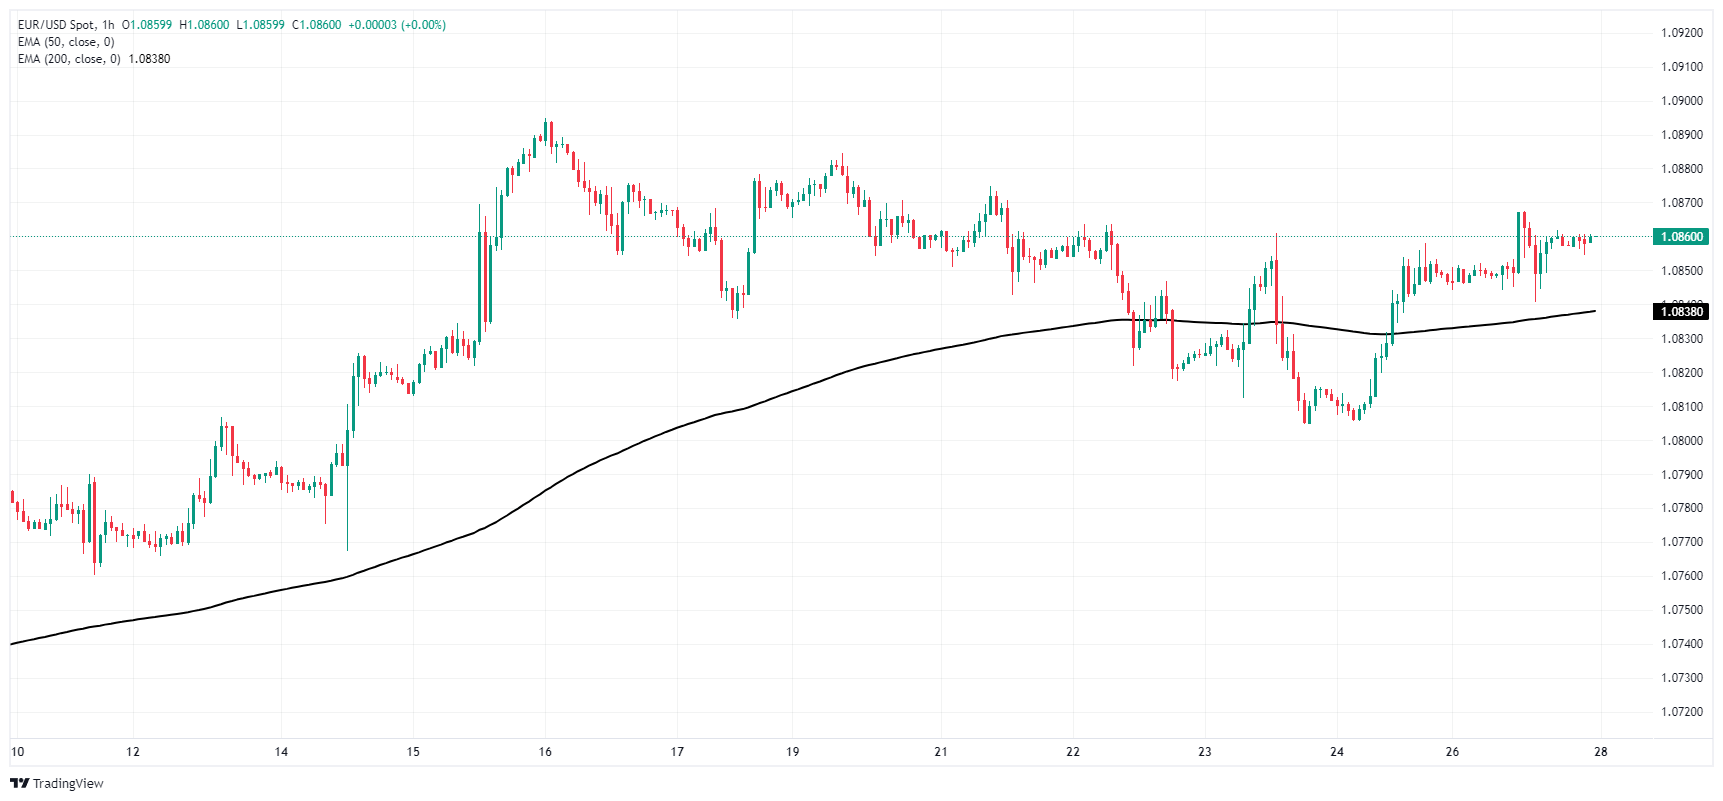
EUR/USD daily chart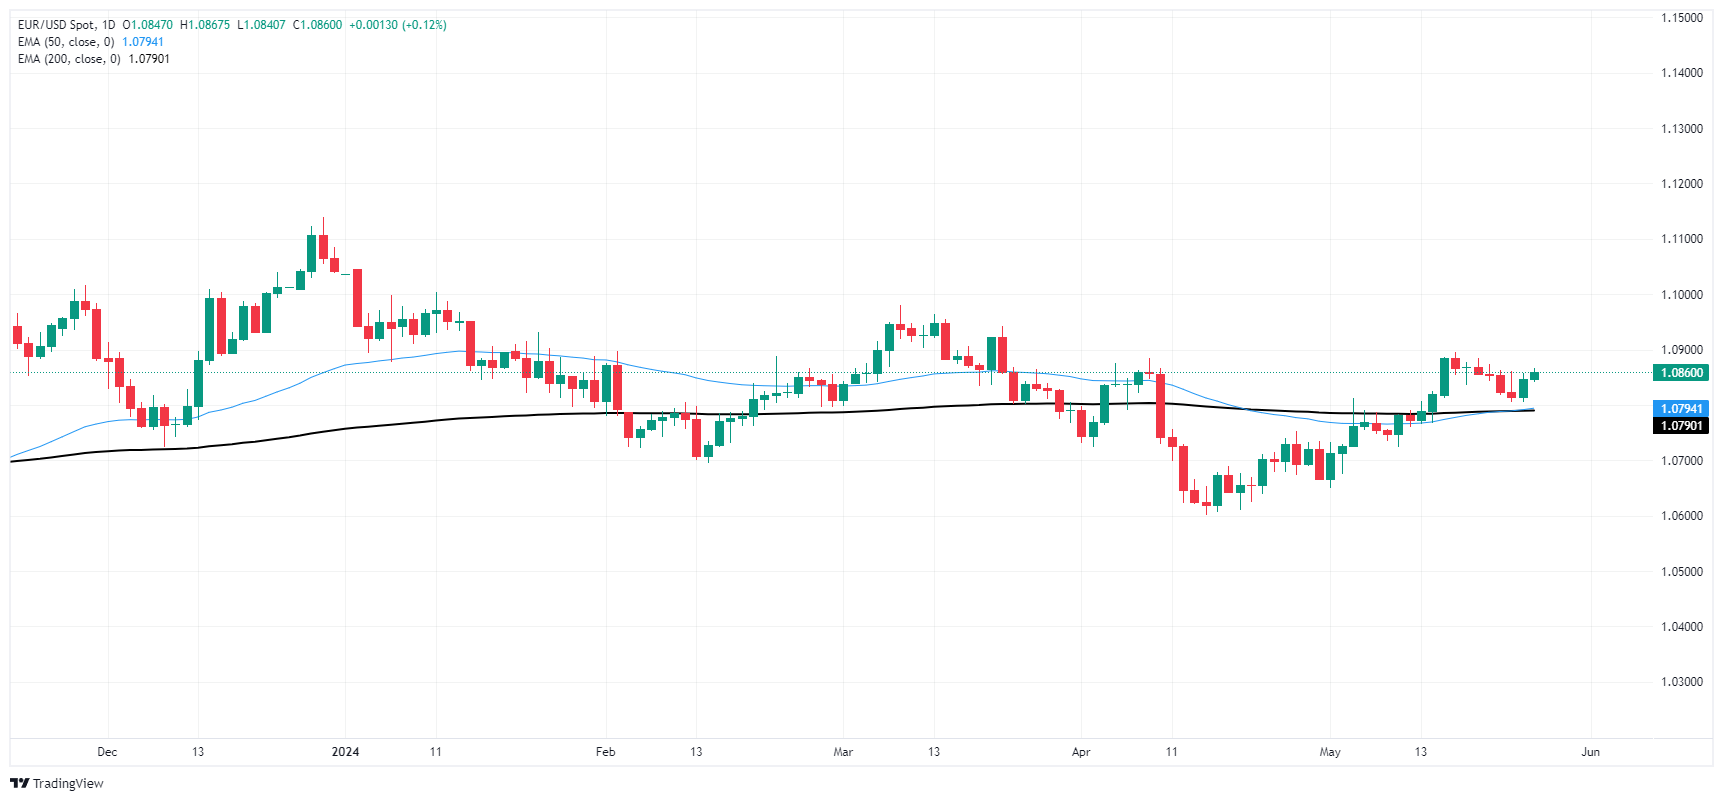
Recommended Articles


