

USD/JPY steady on Friday after another week of gains
- US Dollar broadly eased on Friday, but held close to flat against Yen.
- Japanese National CPI inflation ticked lower in April.
- Risk appetite recovered after US consumer inflation outlook improved.
USD/JPY churned on Friday, wrapping up close to where it started the day, just below the 157.00 handle, as investors looked to recover balance after a tense week.
Broad hopes for a September rate cut from the Federal Reserve (Fed) were knocked back this week after rate markets repriced odds of at least a quarter-point cut in September to less than even. Rate markets were pricing in upwards of 70% odds of a 25-basis-point trim in September at the start of the week.
Forecasting the Coming Week: Fedspeak and PCE remain in the spotlight
Japan’s National Consumer Price Index (CPI) inflation eased to 2.5% YoY in April, but the Bank of Japan (BoJ) remains bitterly determined to hold interest rates at rock-bottom, near-negative levels until they see an expected downturn in inflation hold above 2%. The BoJ currently expects CPI inflation to slump below 2.0% through 2025 and some of 2026.
With the BoJ squarely focused on fears of disinflation, depressed Japanese interest rates continue to erode the Yen. The BoJ and Japan’s Ministry of Finance is widely believed to have directly intervened in global markets in early May, and the BoJ’s financial operations reporting reveal a nine trillion Yen gap between reported operations spending and broker forecasts, adding weight to “Yentervention” speculation.
Despite operations in global markets, the Yen continues to shed weight, and Yen-based pairs are grinding back towards record highs.
USD/JPY technical outlook
USD/JPY cycled the 157.00 handle on Friday, churning chart paper close to near-term highs. USD/JPY has closed in the green for all but three of the last 15 consecutive trading days, recovering from a post-”Yentervention” low near 152.00.
The pair is still trading down from multi-year highs set in late April above 160.00, but USD/JPY continues to drift deeper into bull country above the 200-day Exponential Moving Average (EMA) at 149.13.
USD/JPY hourly chart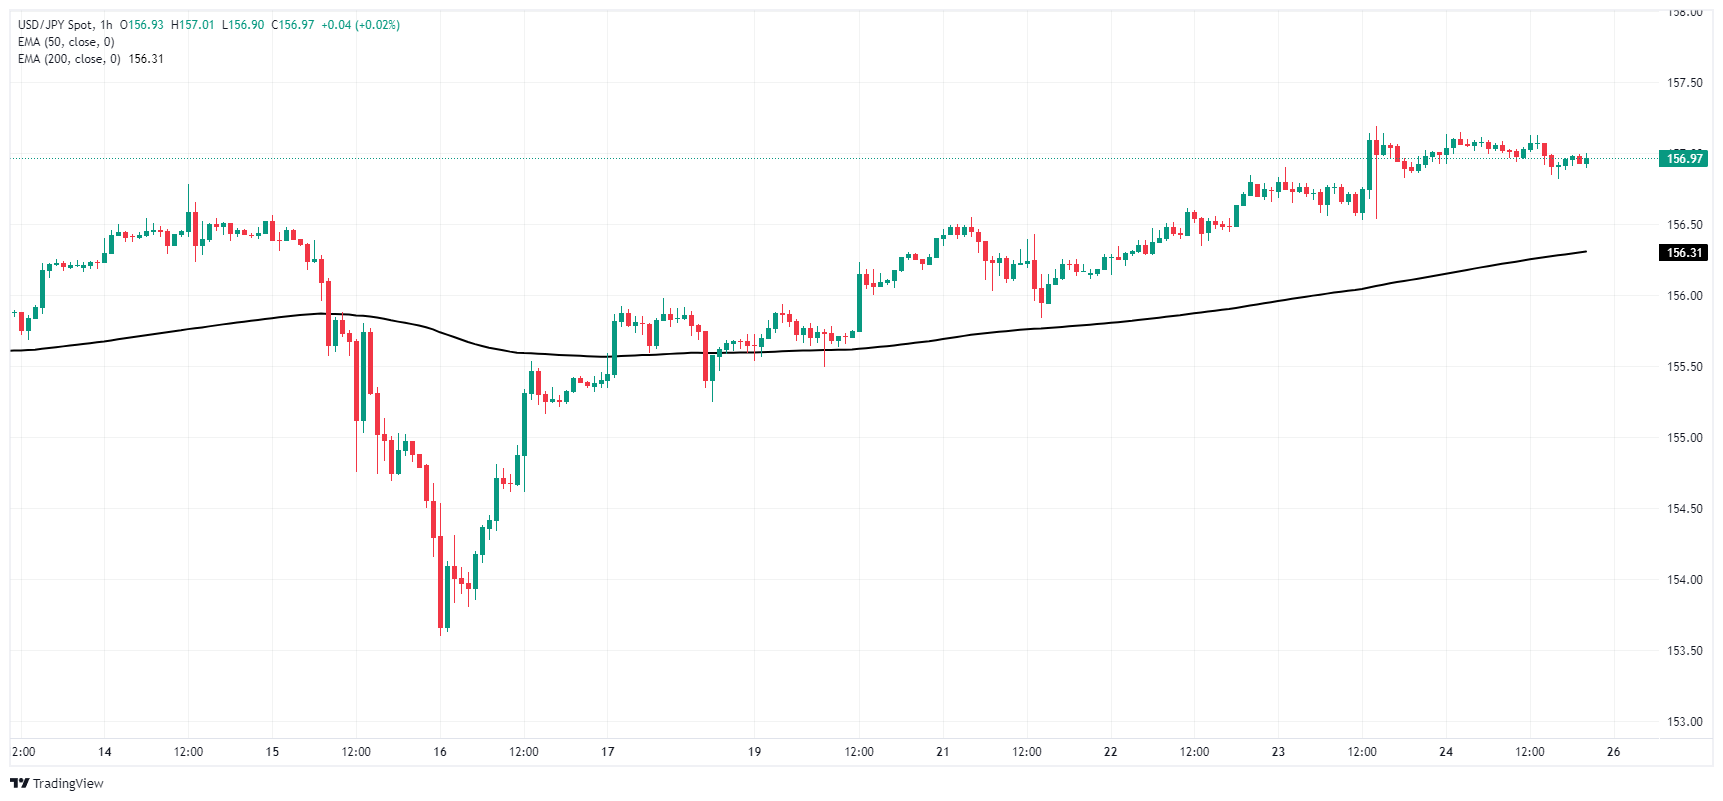
USD/JPY daily chart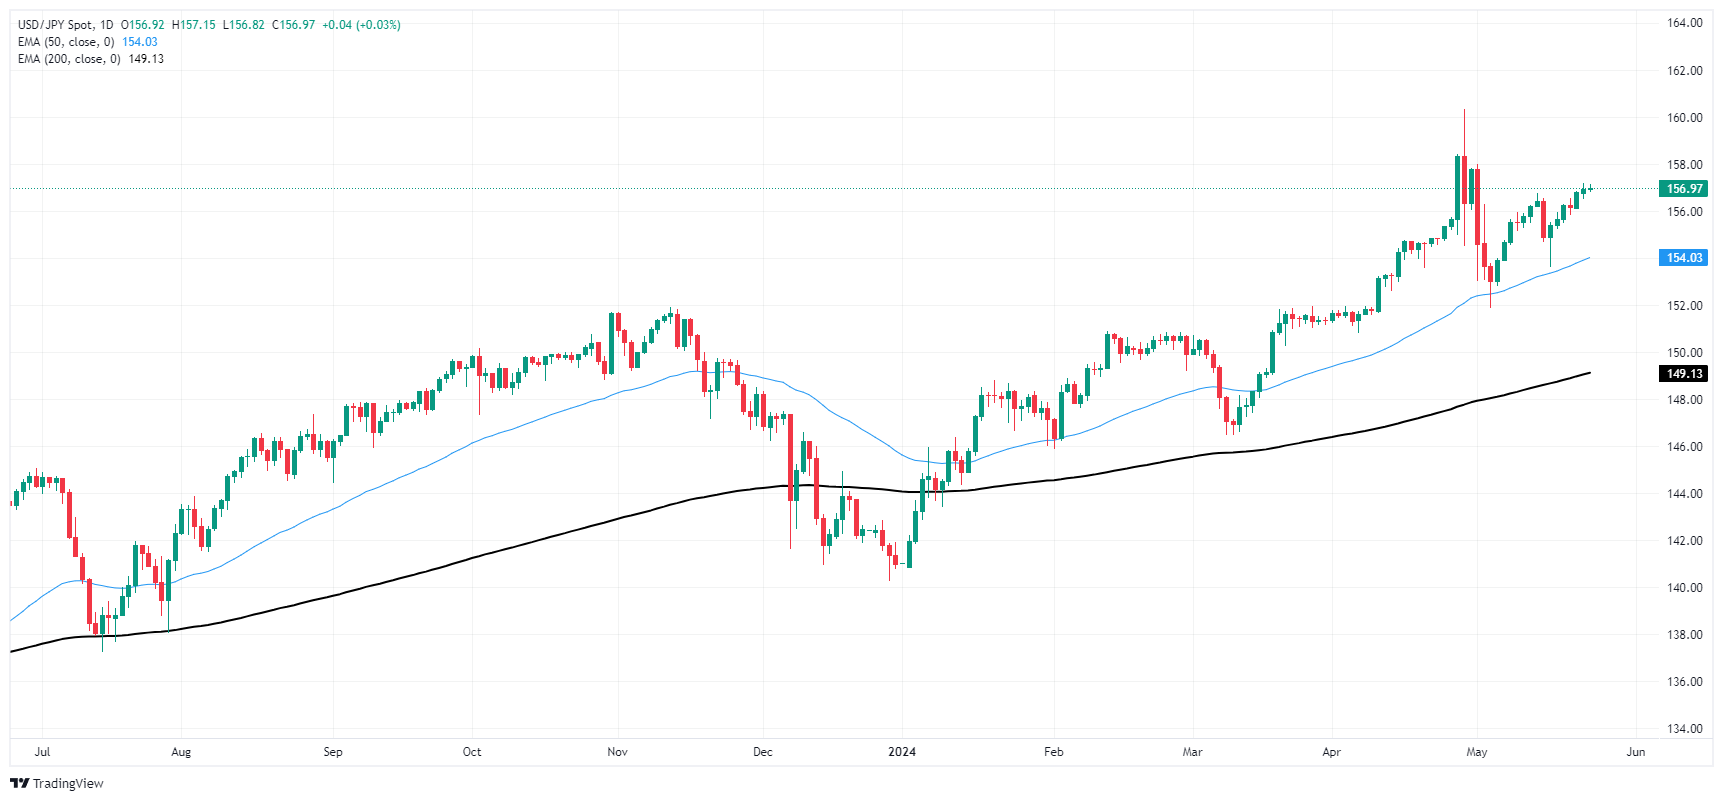
Recommended Articles


