

NZD/USD heads into Friday markets on the low side of near-term consolidation
- NZD/USD eased to the bottom of a sideways pattern on Thursday.
- Resurging fears of fewer Fed cuts bolstered Greenback.
- NZ Consumer Confidence, Inflation Expectations recover ground but remain low.
NZD/USD descended to the bottom of recent consolidation as broad-market risk appetite turned sour on Thursday after rising US Purchasing Manager Index (PMI) figures re-ignited concerns that sticky inflation from the services sector could keep price growth elevated for much longer than rate-cut-hungry investors had initially hoped. Rate cut expectations knocked lower through the day, dragging risk assets lower and bumping the US Dollar into higher bids on the day.
Forex Today: Data continues to rule the sentiment
The Kiwi is heading into the early Friday market session on the low end, but could find thin support from a slight improvement in New Zealand Consumer Confidence figures. ANZ Roy Morgan Consumer Confidence in May rose to 84.9 from April’s 81.9. Despite the rebound, New Zealand consumer confidence remains on the low side in the aggregate, sticking close to values seen during the pandemic response.
Read more: ANZ Roy Morgan Consumer Confidence rebounds to 84.9 in May
Consumer Inflation Expectations in May also eased further, declining to 3.8% compared to April’s 4.4%. On the other hand, Consumer House Price Inflation rose further to 3.5% from 3.2%.
NZD/USD technical outlook
The Kiwi has been churning sideways recently, with a technical ceiling hardening from 0.6140. Bids are catching technical support from the 200-hour Exponential Moving Average (EMA) near 0.6089.
Daily candlesticks are catching a squeeze pattern into the midrange with the pair trading just north of the 200-day EMA at 0.6070.
NZD/USD hourly chart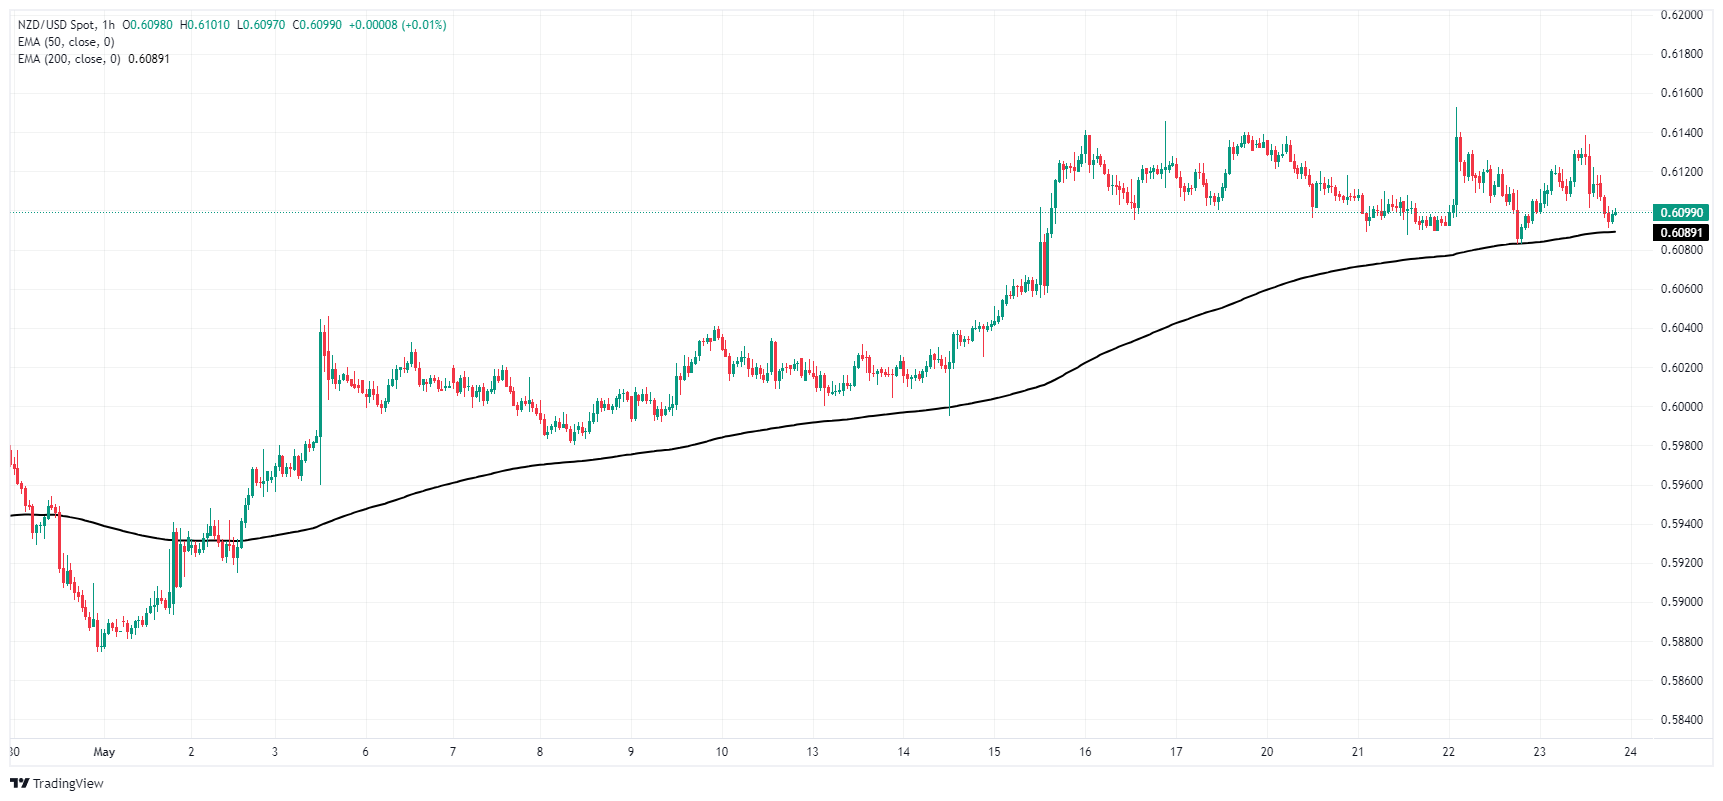
NZD/USD daily chart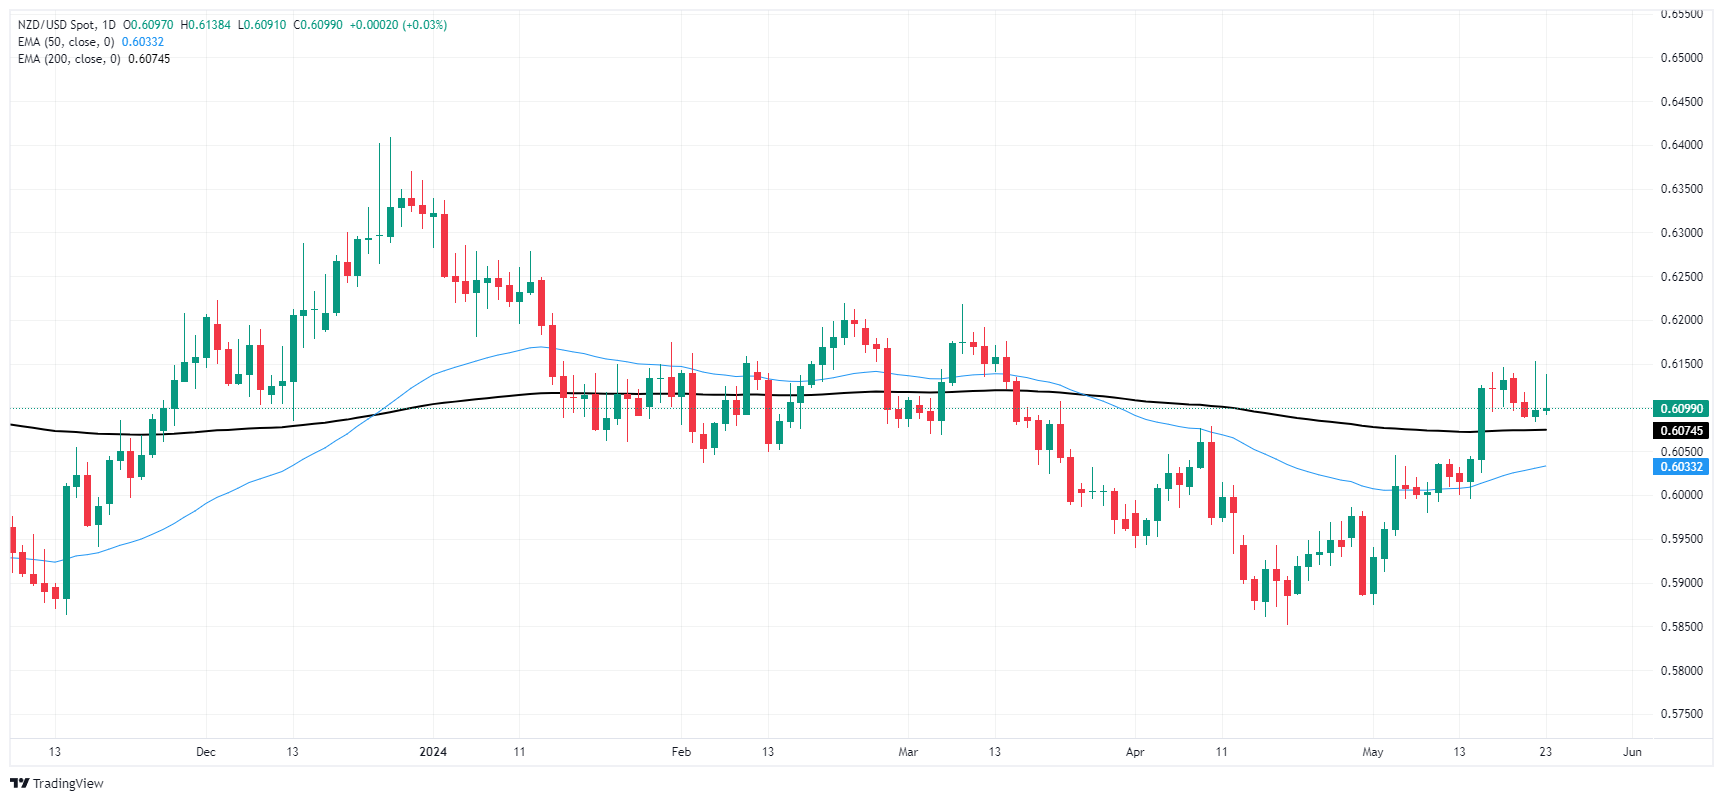
Recommended Articles


