EUR/GBP retreats as chances of BoE's June cut plunge after UK's CPI

Source Fxstreet
  • EUR/GBP slides to 0.8505, posting 0.37% losses as sterling strengthens during Wednesday's trading period.
  • Following the UK's CPI, markets foresee diminishing odds for a BoE rate cut in June, bolstering the pound vs the euro.
  • The ECB is still considering a potential policy rate cut in June and divergences may favor the Pound.

The EUR/GBP traded lower falling to 0.8505 on Wednesday after the Pound garnered strength following the Office for National Statistics (ONS) releasing inflation data higher than the market's expectations. This pushed down the odds of a June rate cut by the Bank of England (BoE), giving a boost to the sterling.

The Office for National Statistics (ONS) of the UK revealed that in April, the inflation rate dipped to 2.3% year-on-year from 3.2% in March, surpassing market expectations of 2.1%, while the core CPI, excluding volatile food and energy prices, rose to 3.9% against an expected 3.6%. As a reaction, forecasts for a Bank of England (BoE) rate cut in June declined sharply from 50% to 12% following the inflation announcement, and those hawkish bets seem to have benefited the Pound.

On the other hand, the European Central Bank (ECB) officials are confident that inflation is under control and are gearing up for a first cut in June. In that sense, in case the BoE and ECB diverge with the British bank delaying cuts, could lay the ground for further downside .

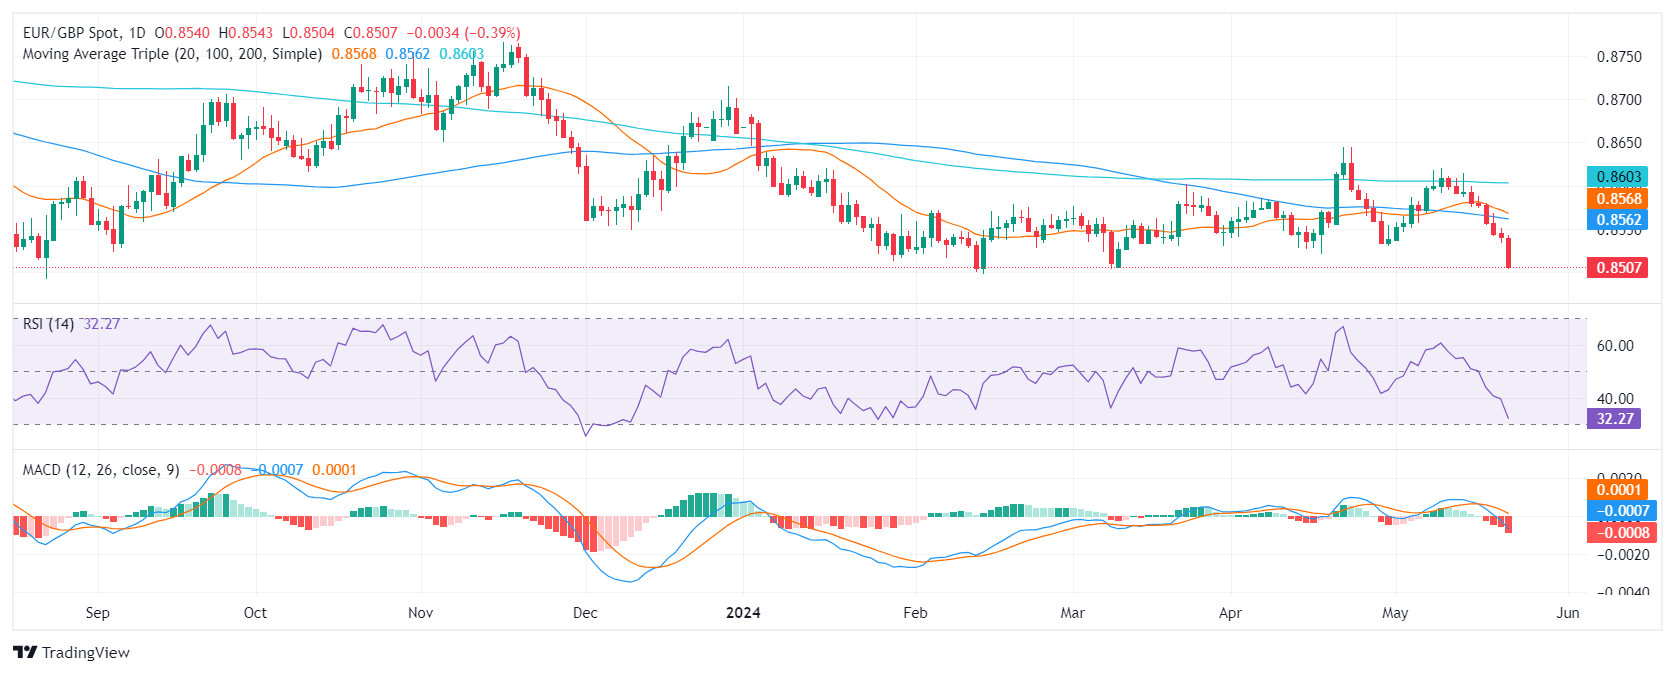
EUR/GBP technical analysis

Examining the daily chart, the Relative Strength Index (RSI) indicates a negative trend, with its most recent value edging towards the oversold territory. Further supporting this bearish outlook is the Moving Average Convergence Divergence (MACD) as it illustrates rising red bars, revealing a rising negative momentum.


EUR/GBP daily chart

Looking at the broader market perspective, the EUR/GBP finds itself in a challenging position in relation to its Simple Moving Averages (SMA), hinting towards a potential further decline. Currently, the alignment is below the 20, 100, and 200-day SMAs. This traditionally suggests a bearish tilt, which is further reinforced by Wednesday’s downward movement.


EUR/GBP

Overview
Today last price 0.851
Today Daily Change -0.0030
Today Daily Change % -0.35
Today daily open 0.854
 
Trends
Daily SMA20 0.8572
Daily SMA50 0.8567
Daily SMA100 0.8563
Daily SMA200 0.8603
 
Levels
Previous Daily High 0.8551
Previous Daily Low 0.8534
Previous Weekly High 0.8614
Previous Weekly Low 0.8555
Previous Monthly High 0.8645
Previous Monthly Low 0.8521
Daily Fibonacci 38.2% 0.854
Daily Fibonacci 61.8% 0.8545
Daily Pivot Point S1 0.8532
Daily Pivot Point S2 0.8524
Daily Pivot Point S3 0.8515
Daily Pivot Point R1 0.855
Daily Pivot Point R2 0.8559
Daily Pivot Point R3 0.8567


Disclaimer: For information purposes only. Past performance is not indicative of future results.
placeholder
Strait of Hormuz Blockade: JPM Warns Crude Production May Halt After 25 Days. How Will US-Iran Conflict Trajectory Affect Global Oil Prices?TradingKey - Following the announcement of a ban prohibiting all vessels from transiting the Strait of Hormuz on the evening of February 28, JPMorgan (JPM) warned that if the Strait of Hormuz is compl
Author  TradingKey
7 hours ago
TradingKey - Following the announcement of a ban prohibiting all vessels from transiting the Strait of Hormuz on the evening of February 28, JPMorgan (JPM) warned that if the Strait of Hormuz is compl
placeholder
WTI Price Forecast: Retreats from seven-month top, still well bid near $71.00 markWest Texas Intermediate (WTI) US Crude Oil prices trim a part of strong intraday gains to levels beyond the $73.00 mark, or the highest since June 2025, touched this Monday in reaction to a dramatic escalation of geopolitical tensions in the Middle East.
Author  FXStreet
9 hours ago
West Texas Intermediate (WTI) US Crude Oil prices trim a part of strong intraday gains to levels beyond the $73.00 mark, or the highest since June 2025, touched this Monday in reaction to a dramatic escalation of geopolitical tensions in the Middle East.
placeholder
Gold jumps over 2% toward $5,400 after US, Israel attack Iran Gold is on fire at the start of the week, a widely expected move, as investors seek harbor in the traditional store of value, following the continued US and Israel attacks on Iran.
Author  FXStreet
16 hours ago
Gold is on fire at the start of the week, a widely expected move, as investors seek harbor in the traditional store of value, following the continued US and Israel attacks on Iran.
placeholder
Oil prices rise as US and Iran extend talks into next weekUS-Iran talks end with no deal but signs of progressOPEC+ to consider oil output increase for April, sources sayBrent and WTI benchmarks register slight daily gainsBy Anna Hirtenstein LONDON, Feb 27 (Reuters) - Oil prices rose on Friday but were on track to finish the week relatively flat after t...
Author  Reuters
Feb 27, Fri
US-Iran talks end with no deal but signs of progressOPEC+ to consider oil output increase for April, sources sayBrent and WTI benchmarks register slight daily gainsBy Anna Hirtenstein LONDON, Feb 27 (Reuters) - Oil prices rose on Friday but were on track to finish the week relatively flat after t...
placeholder
Silver Price Forecast: XAG/USD jumps above $90 as AI valuation risks boost safe-haven demandSilver price (XAG/USD) is up 2.4% to near $90.60 during the European trading session on Friday. The white metal strengthens as escalating concerns over valuations of Artificial Intelligence (AI) stocks have prompted demand for safe-haven assets.
Author  FXStreet
Feb 27, Fri
Silver price (XAG/USD) is up 2.4% to near $90.60 during the European trading session on Friday. The white metal strengthens as escalating concerns over valuations of Artificial Intelligence (AI) stocks have prompted demand for safe-haven assets.
Related Instrument
goTop
quote