USD/CHF Price Analysis: Breaking back inside rising channel as bulls reassert control

Source Fxstreet
  • USD/CHF is breaking back inside the rising channel it broke out of last week. 
  • This is probably a sign the dominant uptrend is resuming and prices will go higher. 
  • A close on a 4-hour basis back inside the channel would help confirm the bullish thesis. 

USD/CHF is in the process of breaking back inside its rising channel as the bull trend tries to pick up momentum following a period of weakness. 

Price broke down and out of its rising channel on May 14. The break signaled a possible bearish reversal, however, price failed to make much headway lower. 

The pair recovered after bottoming on May 16 and began clawing its way higher. It has now broken back inside the channel and if the current 4-hour candle ends with a bullish close it will probably signal a resumption of the uptrend after a false break. 

USD/CHF 4-hour Chart


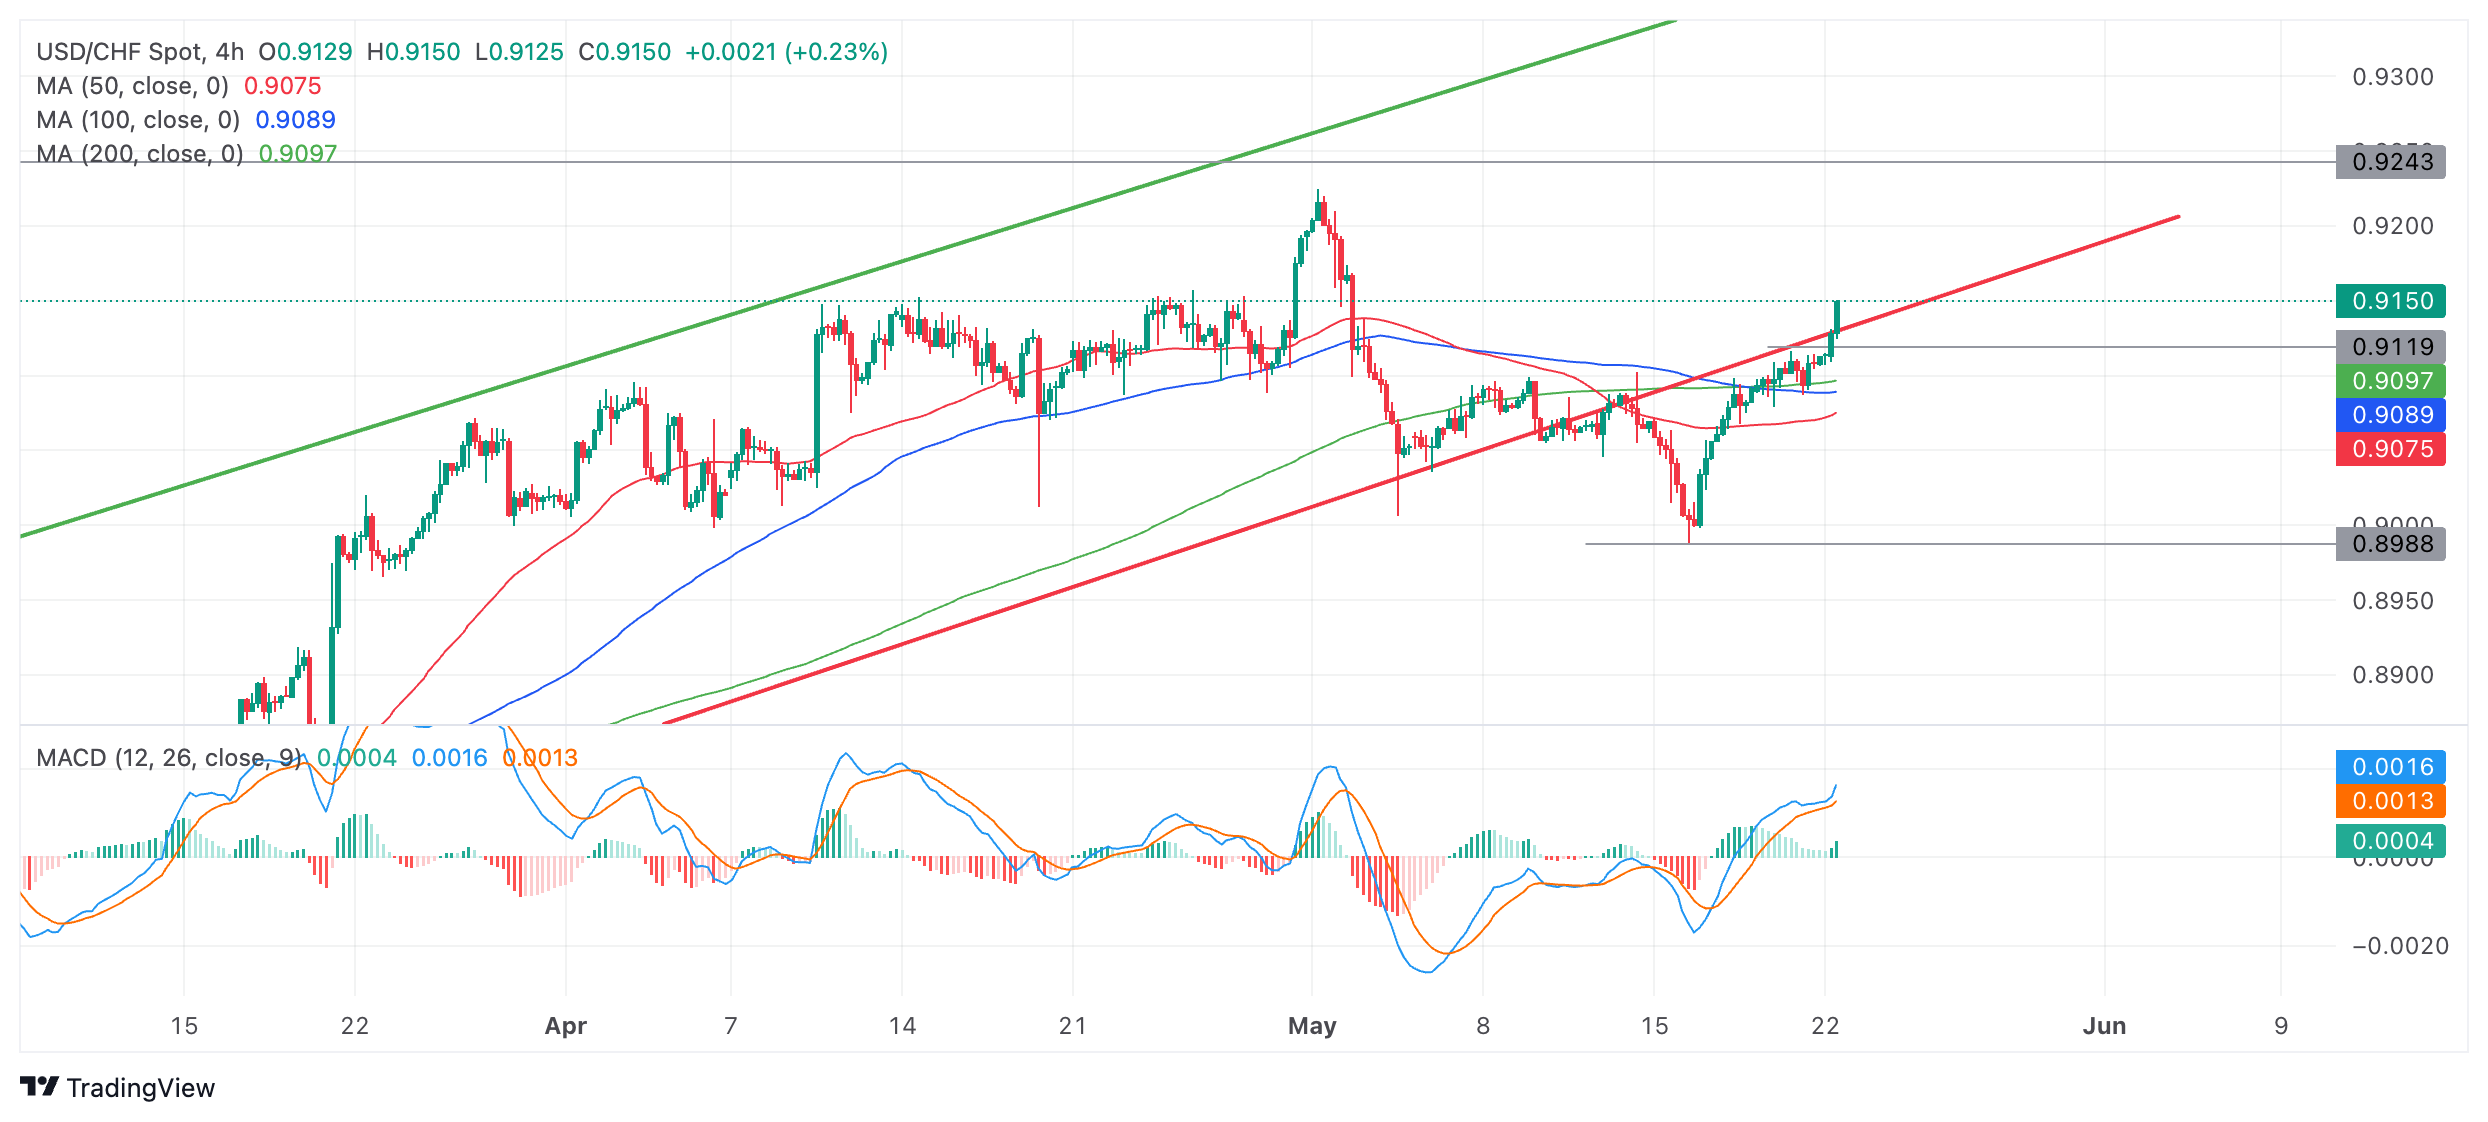
The pair has been rising in a channel since the start of 2024. Given the received wisdom that “the trend is your friend” this broad uptrend should continue. 

In the short term the outlook is clarifying. For a while it looked as if the channel breakdown had reversed the short-term trend. However, price rallied and the current candle on the 4-hour has actually penetrated decisively back inside the channel. If the current candle ends on a bullish note it will indicate price has clearly broken back inside its rising channel, and the uptrend should extend quite happily upwards. In such a scenario USD/CHF would be expected to reach close to the 0.9225 highs of the year. 

Until the current period closes, however, it is impossible to assess with any degree of certainty whether bulls have been victorious. It is possible, for example, that price could recapitulate and fall back down to below the red trendline before the current candle closes – invalidating the bullish recovery hypothesis. 

It would require a significant drop to reverse the trend, however, with price needing to break back below the breakout move low at 0.8988 to suggest a reversal and continuation south. 

Disclaimer: For information purposes only. Past performance is not indicative of future results.
placeholder
Natural Gas sinks to pivotal level as China’s demand slumpsNatural Gas price (XNG/USD) edges lower and sinks to $2.56 on Monday, extending its losing streak for the fifth day in a row. The move comes on the back of China cutting its Liquified Natural Gas (LNG) imports after prices rose above $3.0 in June. It
Author  FXStreet
Jul 01, 2024
Natural Gas price (XNG/USD) edges lower and sinks to $2.56 on Monday, extending its losing streak for the fifth day in a row. The move comes on the back of China cutting its Liquified Natural Gas (LNG) imports after prices rose above $3.0 in June. It
placeholder
ECB Policy Outlook for 2026: What It Could Mean for the Euro’s Next MoveWith the ECB likely holding rates steady at 2.15% and the Fed potentially extending cuts into 2026, EUR/USD may test 1.20 if Eurozone growth proves resilient, but weaker growth and an ECB pivot could pull the pair back toward 1.13 and potentially 1.10.
Author  Mitrade
Dec 26, 2025
With the ECB likely holding rates steady at 2.15% and the Fed potentially extending cuts into 2026, EUR/USD may test 1.20 if Eurozone growth proves resilient, but weaker growth and an ECB pivot could pull the pair back toward 1.13 and potentially 1.10.
placeholder
Gold retreats sharply from two-week top/$4,800 as Trump’s Iran comments boost USDGold (XAU/USD) witnessed an intraday turnaround from the $4,800 mark, or a fresh two-week high set earlier this Thursday, and for now, seems to have snapped a four-day winning streak amid resurgent US Dollar (USD) demand.
Author  FXStreet
Apr 02, Thu
Gold (XAU/USD) witnessed an intraday turnaround from the $4,800 mark, or a fresh two-week high set earlier this Thursday, and for now, seems to have snapped a four-day winning streak amid resurgent US Dollar (USD) demand.
placeholder
WTI eases below $103.50 as US, Iran reportedly seeking 45-day ceasefireWest Texas Intermediate (WTI), the US crude oil benchmark, is trading around $103.30 during the early European trading hours on Monday. The WTI price retreats after reports that the United States (US) and Iran are making a push for a 45-day ceasefire. 
Author  FXStreet
Apr 06, Mon
West Texas Intermediate (WTI), the US crude oil benchmark, is trading around $103.30 during the early European trading hours on Monday. The WTI price retreats after reports that the United States (US) and Iran are making a push for a 45-day ceasefire. 
placeholder
Crypto Weekly Radar: All eyes on Donald Trump’s ultimatum, US macroeconomic dataCrypto markets begin the week with mixed sentiment, with Bitcoin (BTC) trading above $69,000 following last week’s rebound. Still, markets remain cautious as traders weigh risks stemming from Donald Trump’s renewed threats toward Iran ahead of the ultimatum set for Tuesday.
Author  FXStreet
Apr 06, Mon
Crypto markets begin the week with mixed sentiment, with Bitcoin (BTC) trading above $69,000 following last week’s rebound. Still, markets remain cautious as traders weigh risks stemming from Donald Trump’s renewed threats toward Iran ahead of the ultimatum set for Tuesday.
Related Instrument
goTop
quote