EUR/GBP Price Analysis: Breakdown from multi-month range

Source Fxstreet
  • EUR/GBP is breaking down out of a multi-month range it has been oscillating within since February. 
  • If price holds below the range lows it could lead to a substantial extension lower. 
  • A break back above the highs of the breakout candle would indicate the break was false.

EUR/GBP has fallen to the floor of a multi-month range and broken decisively below on a 4-hour period closing basis. 

A close below the 0.8513 low of the candle that pierced through the floor would provide added confirmation of more downside. 

EUR/GBP 4-hour Chart 
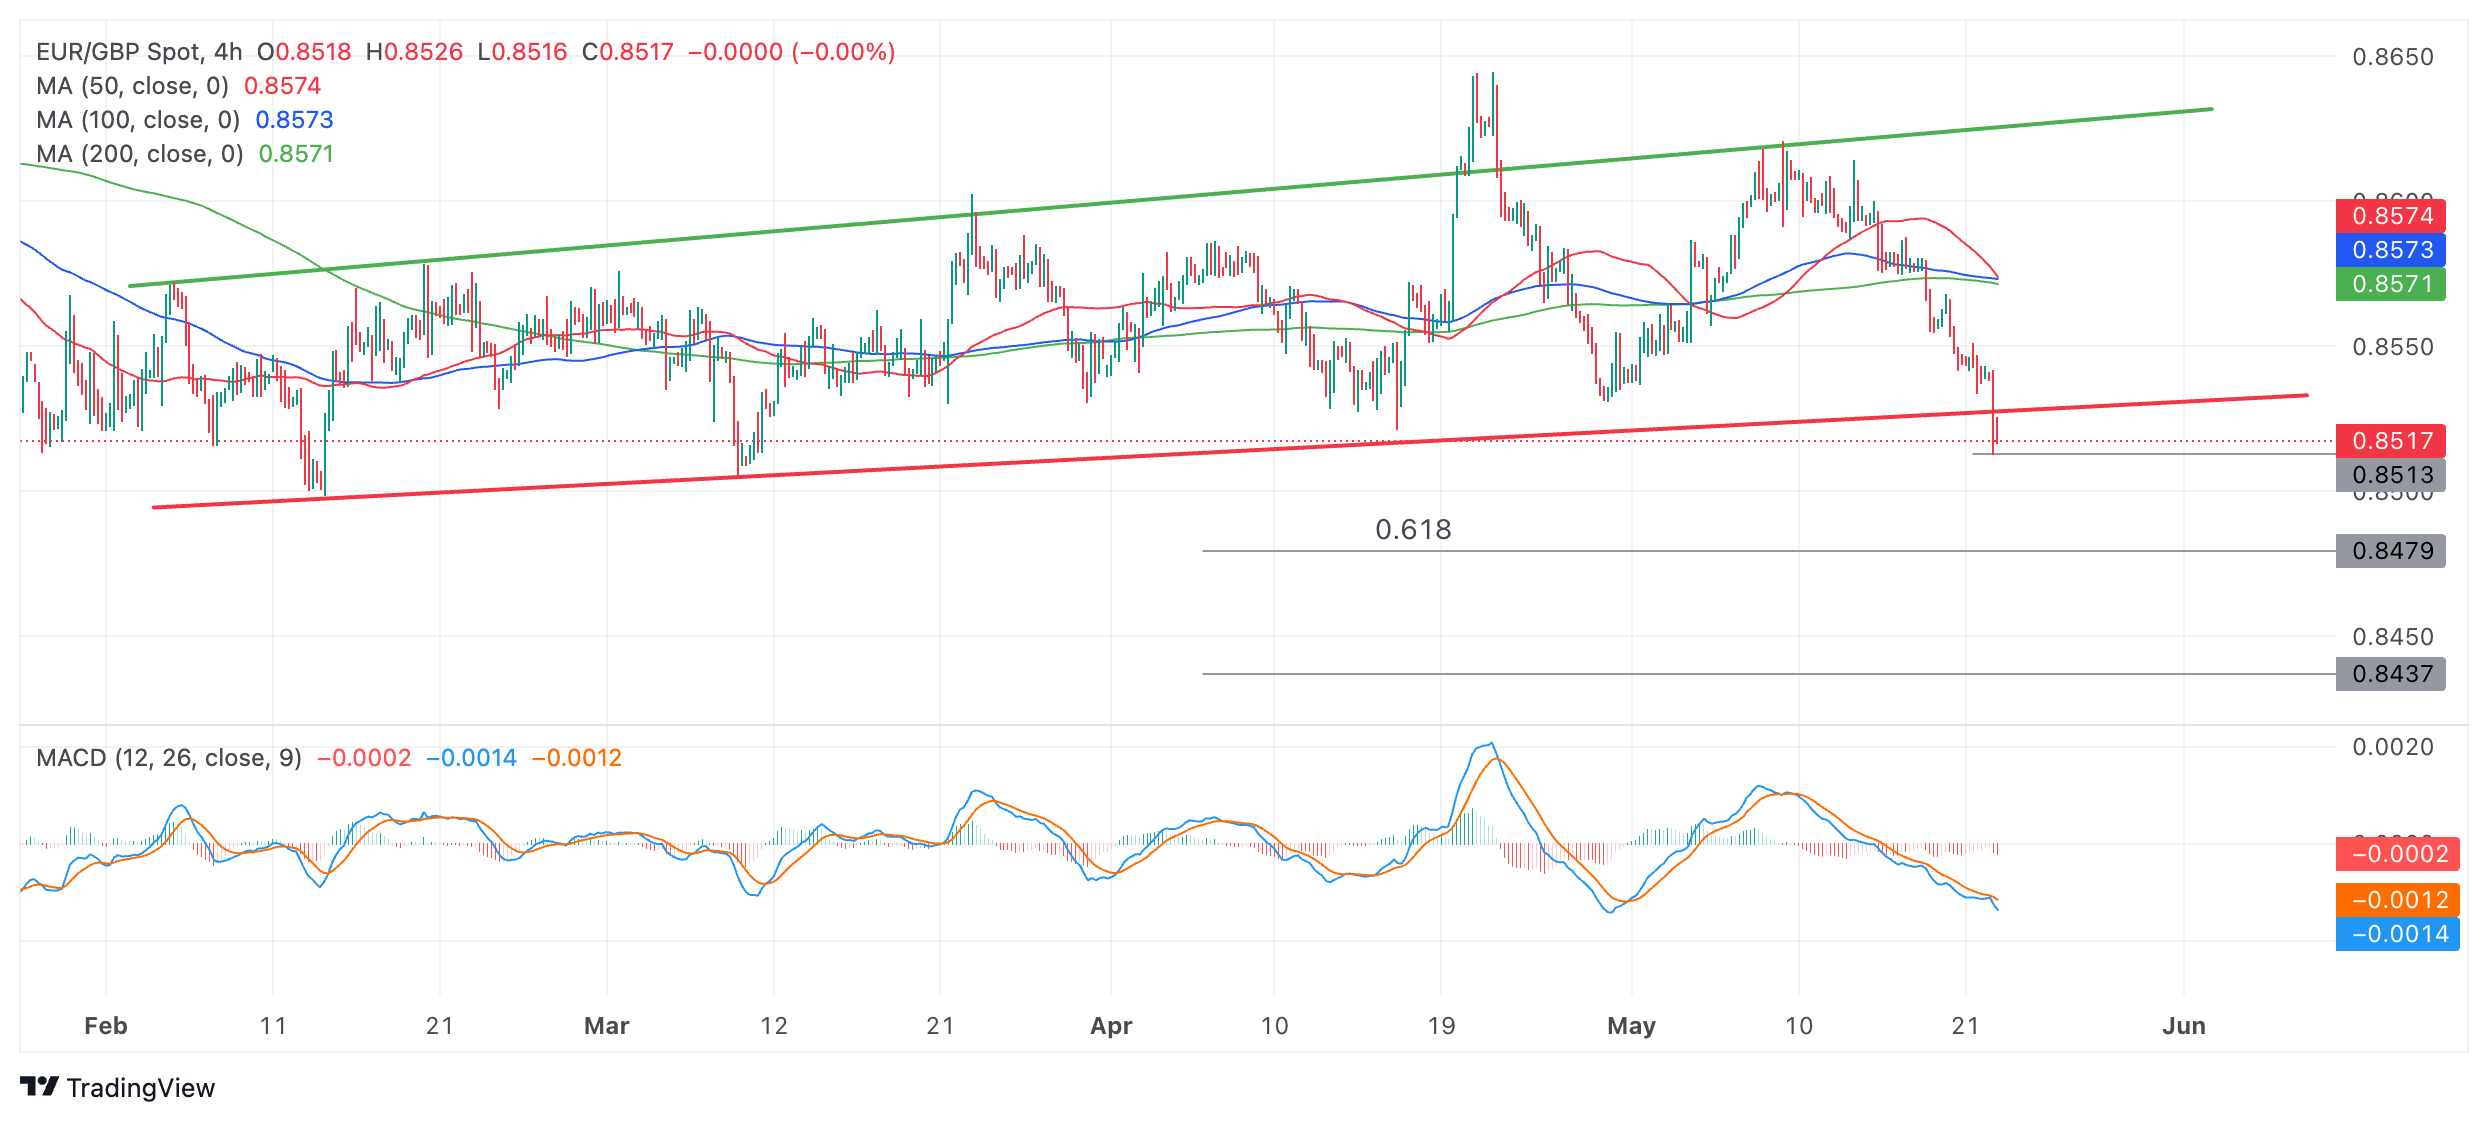


The customary method for forecasting how far a breakout move will go is to take the height of the range and extrapolate it lower from the breakout point. This gives two targets: a conservative objective at the 0.618 Fibonacci ratio – and a more optimistic target at the full 100% of the height of the range extrapolated lower. 

The conservative target lies at roughly 0.8479 and the more optimistic objective at 0.8437. 

The Moving Average Convergence Divergence (MACD) indicator is in the negative zone and looking a little oversold. If it crosses back above the signal line it could signal a recovery. Crosses of the MACD above or below its signal line have been a reliable indicator of oscillations in price during the unfolding of the range. 

There is a risk the break is a “false break” and price will recover and move back up inside the range. EUR/GBP is, after all, in a sideways trend, and “the trend is your friend”. A close back above the 0.8542 high of the breakdown candle would provide evidence the sideways trend is probably extending further. It would suggest a strong possibility of a move back up to the range high in the 0.8620s.


Disclaimer: For information purposes only. Past performance is not indicative of future results.
placeholder
Top 3 Price Prediction: Bitcoin, Ethereum, Ripple – BTC, ETH and XRP Look for a Foothold After a Sharp ShakeoutBitcoin trades near $92,600 after a dip below $90,000, while Ethereum around $3,118 and XRP near $2.21–$2.23 sit on key support zones, as BTC, ETH and XRP all try to turn a sharp correction into a tradable rebound rather than a deeper slide.
Author  Mitrade
Nov 19, Wed
Bitcoin trades near $92,600 after a dip below $90,000, while Ethereum around $3,118 and XRP near $2.21–$2.23 sit on key support zones, as BTC, ETH and XRP all try to turn a sharp correction into a tradable rebound rather than a deeper slide.
placeholder
Market Meltdown: BTC, ETH, and XRP Capitulate as Bears Seize ControlBitcoin trades around $85,900 after breaking below $86,000, with Ethereum under $2,791 and XRP below $1.99 as BTC, ETH and XRP extend weekly losses of 8–10%, forcing traders to focus on supports at $85,000, $2,749 and $1.77 for clues on whether this sell-off has further to run.
Author  Mitrade
Nov 21, Fri
Bitcoin trades around $85,900 after breaking below $86,000, with Ethereum under $2,791 and XRP below $1.99 as BTC, ETH and XRP extend weekly losses of 8–10%, forcing traders to focus on supports at $85,000, $2,749 and $1.77 for clues on whether this sell-off has further to run.
placeholder
Bitcoin Volatility Spikes: Is Options-Driven Pricing Making a Comeback?Bitcoin's volatility is surging, suggesting a shift back to options-driven price action seen before Bitcoin ETFs were launched.
Author  Mitrade
8 hours ago
Bitcoin's volatility is surging, suggesting a shift back to options-driven price action seen before Bitcoin ETFs were launched.
placeholder
2025 Black Friday is coming! Which stocks may see volatility?Coming on the day right after Thanksgiving in the United States, Back Friday marks the start of the holiday shopping season. Sales data from this shopping frenzy day reflects investor confidence and consumer trends. The National Retail Federation (NRF) predicts that holiday season (Nov and Dec) retail sales in 2025 will likely exceed $1 trillion for the very first time, which represents a year-over-year increase of 3.7 to 4.2 percent. Historic data from the past decade show that the retail sector has generally outperformed the S&P 500 during the weeks before and after Black Friday. The following retailing companies are expected to be big winners:
Author  Insights
5 hours ago
Coming on the day right after Thanksgiving in the United States, Back Friday marks the start of the holiday shopping season. Sales data from this shopping frenzy day reflects investor confidence and consumer trends. The National Retail Federation (NRF) predicts that holiday season (Nov and Dec) retail sales in 2025 will likely exceed $1 trillion for the very first time, which represents a year-over-year increase of 3.7 to 4.2 percent. Historic data from the past decade show that the retail sector has generally outperformed the S&P 500 during the weeks before and after Black Friday. The following retailing companies are expected to be big winners:
placeholder
Top 3 Price Prediction: Bitcoin, Ethereum, Ripple – BTC, ETH and XRP Attempt Recovery Post-SelloffBitcoin trades back above $87,700 after a 20% drop, while Ethereum rebounds from support around $2,749 and XRP recovers above $2.08 off its $1.96 floor, as BTC, ETH and XRP all try to turn last week’s steep correction into the start of a broader recovery.
Author  Mitrade
5 hours ago
Bitcoin trades back above $87,700 after a 20% drop, while Ethereum rebounds from support around $2,749 and XRP recovers above $2.08 off its $1.96 floor, as BTC, ETH and XRP all try to turn last week’s steep correction into the start of a broader recovery.
goTop
quote