

GBP/JPY coils just beneath 199.00 as markets await UK CPI inflation
- GBP/JPY held steady in thin Tuesday markets.
- Japanese data remains strictly mid-tier this week.
- UK slated to bring key data through the back half of the trading week.
GBP/JPY remains in a tight holding pattern just south of the 199.00 handle as Pound Sterling (GBP) traders await key data prints from the UK to pick a direction. Japanese data remains thin this week, leaving Guppy traders to focus on UK Consumer Price Index (CPI) inflation and Purchasing Managers Index (PMI) figures.
At current tally, Japan is believed to have spent around 60 billion Yen trying to defend the battered Japanese currency recently. The Bank of Japan (BoJ) has not officially confirmed or denied outright market operations. Still, closely-watched financial reporting from the Japanese central bank have shown a much wider gap between market analyst expectations and actual reported financial operations.
Despite possible interventions in global FX markets on behalf of the Yen, GBP/JPY is steadily approaching record highs once more as the JPY slumps across broader markets with the BoJ staunchly holding interest rates near zero.
The UK’s latest CPI inflation print is due in the upcoming Wednesday session, and is expected to cool to 0.2% in April, compared to the previous month’s 0.6%. Investors are looking for signs of a summer rate cut from the Bank of England (BoE), and markets will be keeping a close eye on UK inflation updates.
GBP/JPY technical outlook
The Guppy has been grinding higher in recent days, but Tuesday saw the pair take a breather, holding steady just below 199.00. The pair is up 1.75% from the last near-term sewing low into 195.00, while recovering nearly 4% from bottom bids priced in near 191.50 after the suspected BoJ interventions.
GBP/JPY hourly chart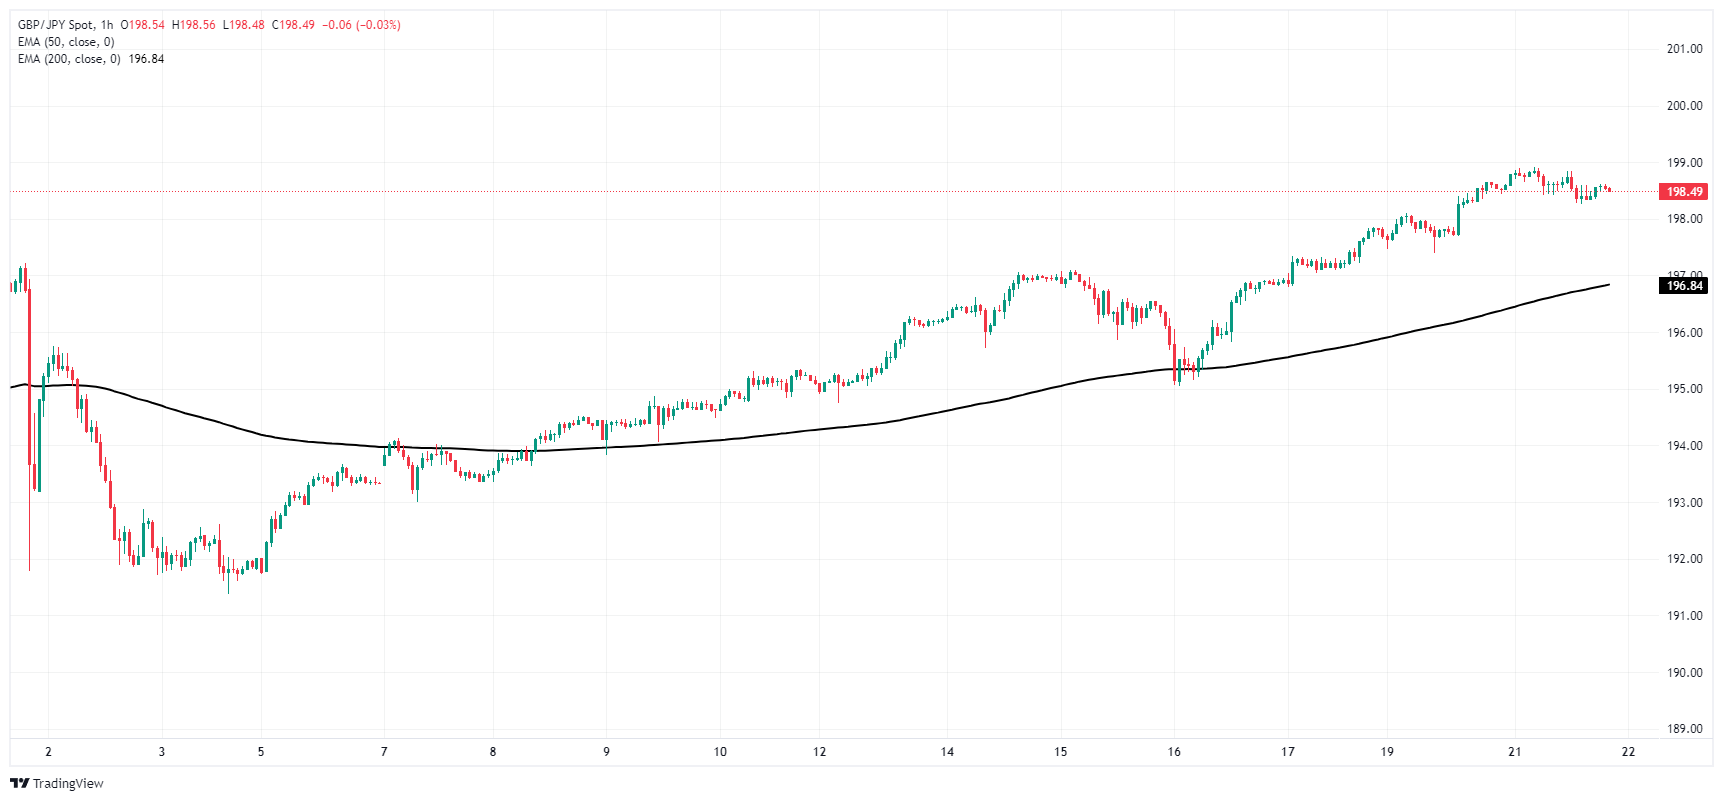
GBP/JPY daily chart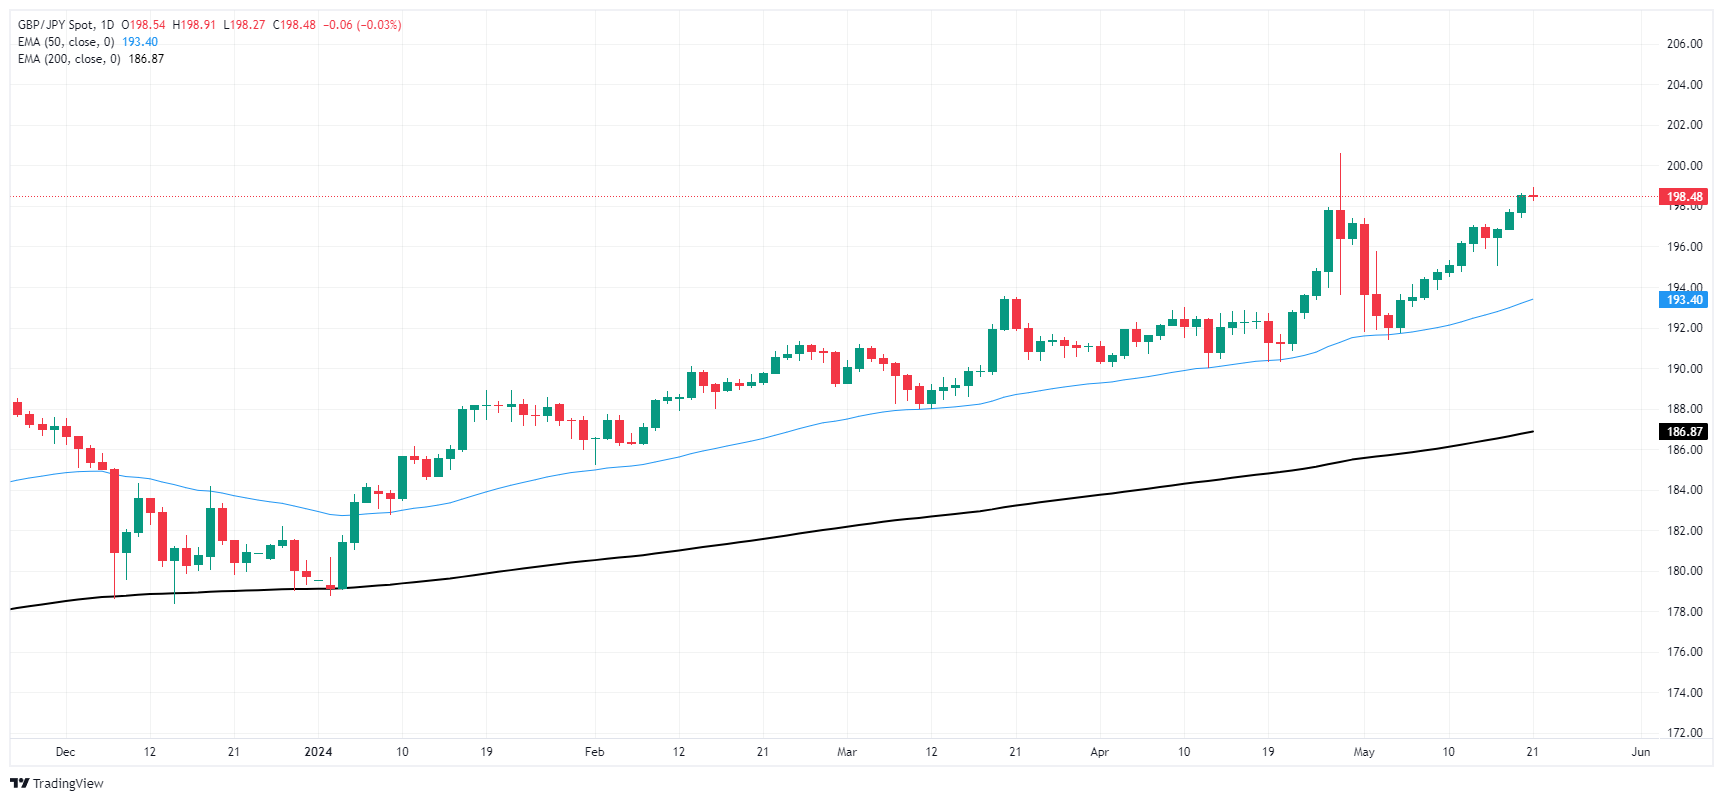
Recommended Articles


