Mexican Peso shrugs off data and sentiment to trend higher

Source Fxstreet
  • The Mexican Peso continues its uptrend despite poor Mexican data and risk aversion. 
  • The wide interest-rate differential between Mexico and Western countries continues to favor the Peso in the carry trade. 
  • USD/MXN hits the conservative target for its range breakout. 

The Mexican Peso (MXN) seesaws between marginal gains and losses in its key pairs on Tuesday after shrugging off poor Retail Sales data from Mexico and hawkish commentary from Federal Reserve (Fed) speakers on Monday, and continuing to drift higher.  

The wide interest-rate differential between Mexico and most major economies – with relatively higher interest rates in Mexico (11.00%) providing an attractive draw for carry traders – is a key factor driving MXN’s uptrend, with little prospect of the gap closing anytime soon. 

USD/MXN is trading at 16.55, EUR/MXN at 17.98 and GBP/MXN at 21.05, at the time of writing. 

Mexican Peso shrugs off poor data 

The Mexican Peso trades relatively flat on Tuesday despite recent data showing a fall in Mexican Retail Sales on both a monthly and yearly basis. 

Whilst the data indicated the high interest rates imposed by the Bank of Mexico (Banxico) are probably having the desired effect of cooling the economy, Banxico has not signaled it is in a hurry to reduce interest rates yet. 

Indeed on Friday, the Deputy Governor of Banxico, Irene Espinosa, said she thought interest rates should remain at their current level until inflation had been brought down on a sustainable basis. 

Somber market mood caps Peso’s upside

The generally somber market mood on Tuesday is capping the Peso’s upside, however, as investors retreat from risk assets and commodities – MXN included – out of a fear high interest rates are here to stay. Asian stocks are down and Oil, metals and softs are following suit. 

The change in sentiment comes as a result of commentary from central bankers, in both the US and Australia, that suggests they are not only reluctant to cut interest rates in the near future but are even discussing raising them. 

In the US, Federal Reserve Bank of Cleveland President Loretta Mester said inflation risks were “tilted to the upside”, that the Fed could “even raise them (rates)” if inflation rose, and that it was “no longer appropriate” to expect the Fed to make three cuts this year. 

The minutes of the RBA May meeting, released on Tuesday morning, showed that the board of governors discussed the possibility of raising interest rates. It was the first time in many months they had discussed further policy tightening. 

Technical Analysis: USD/MXN hits first downside target

USD/MXN – or the number of Pesos that can be bought with one US Dollar – edges lower on Tuesday, continuing its overall bearish bias of recent weeks. 

USD/MXN 4-hour Chart 

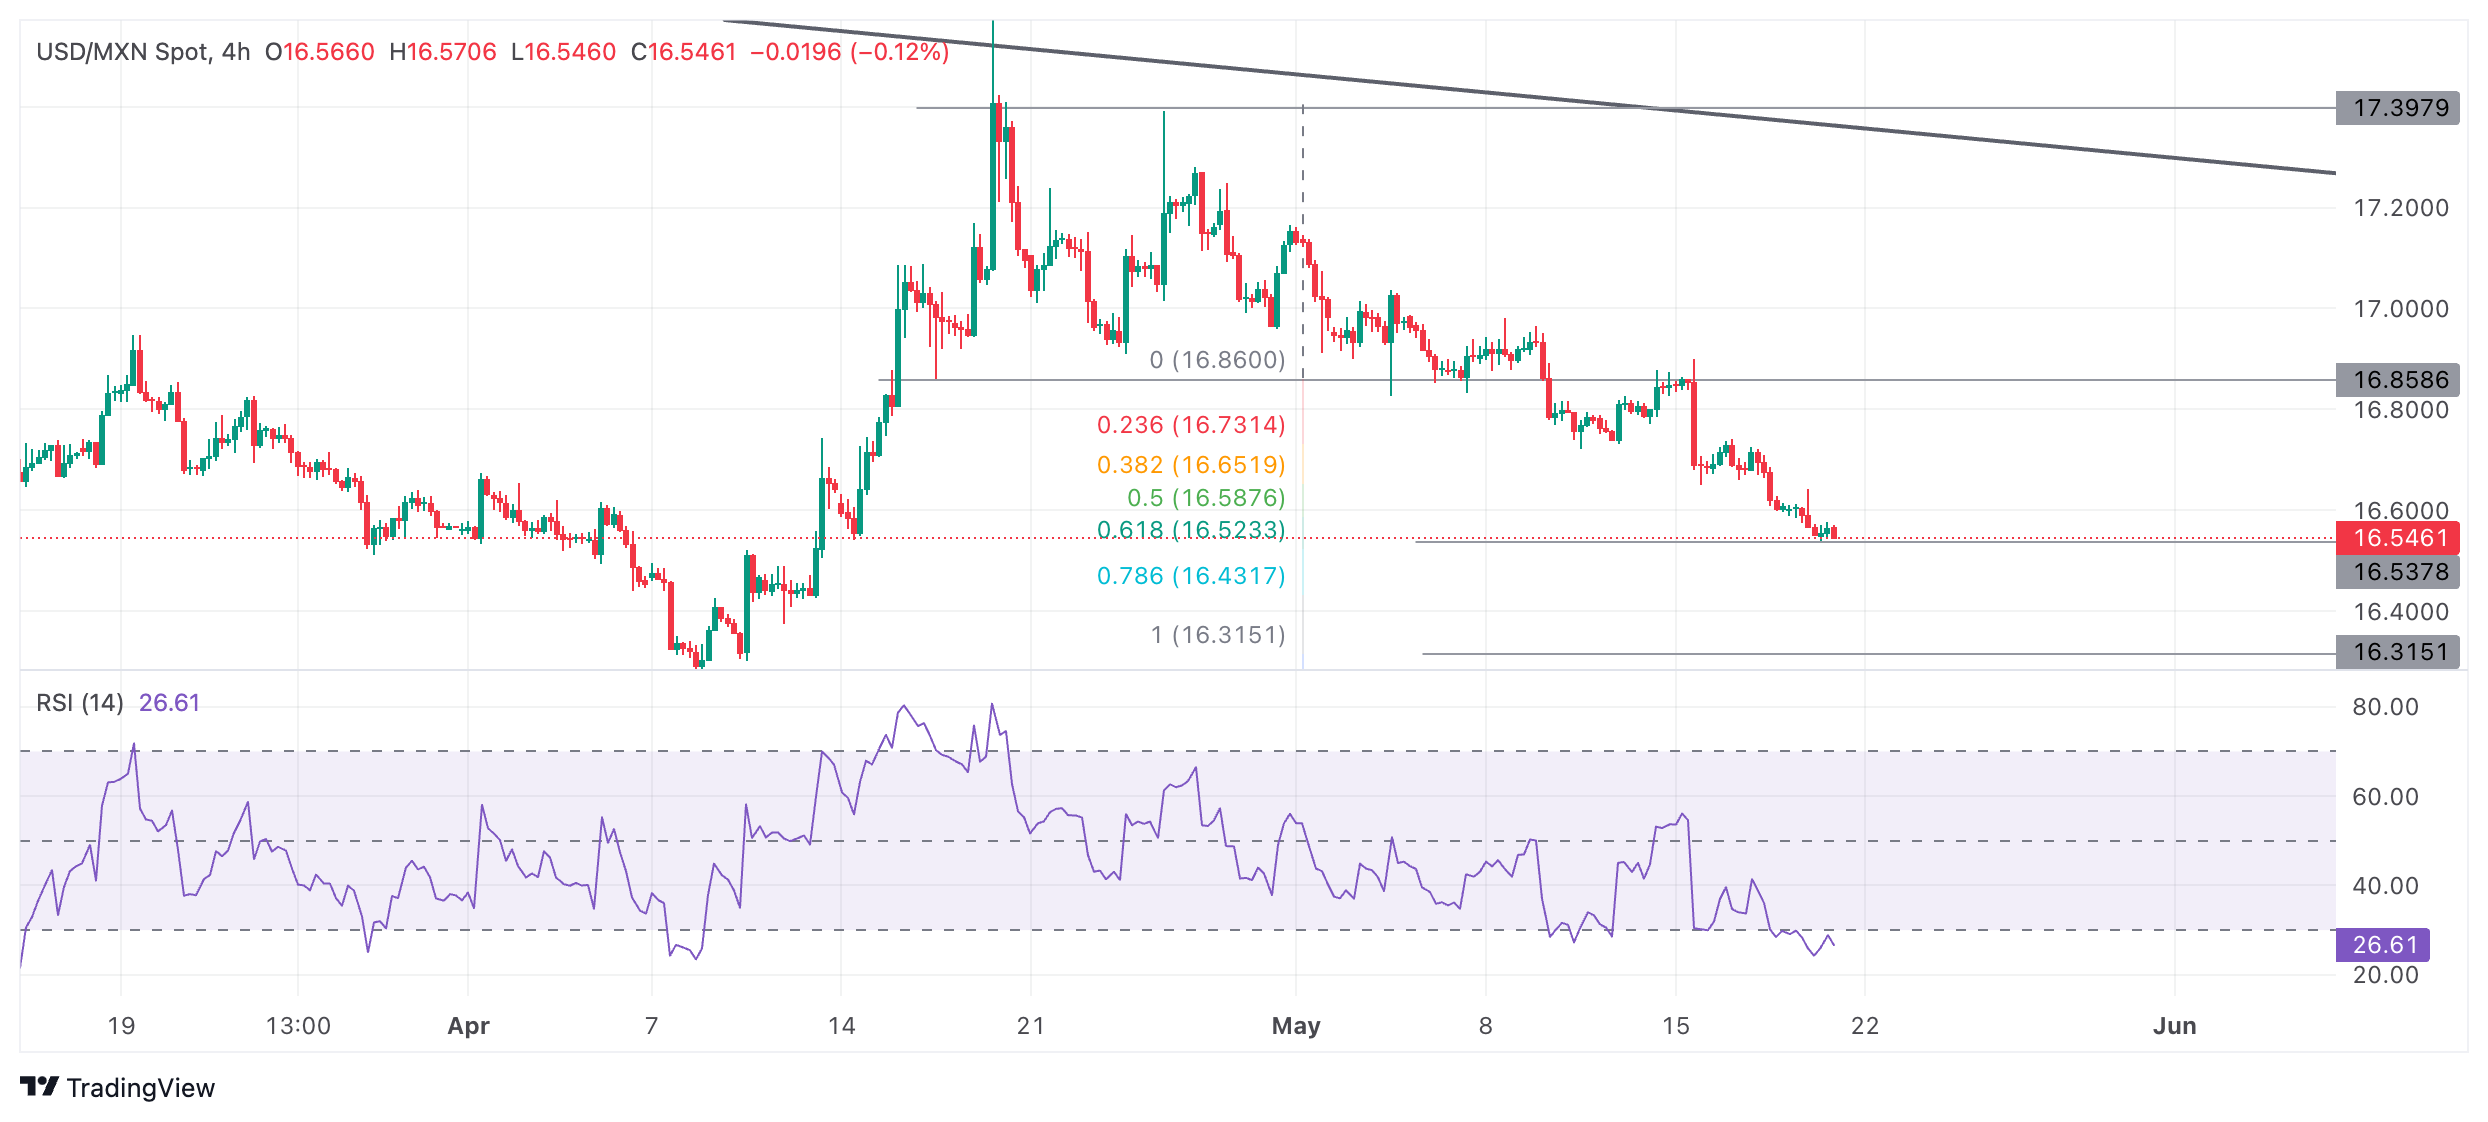
USD/MXN is falling in a short-term downtrend within a descending channel that favors short bets over longs. 

The pair has now just reached its conservative price objective for the breakout of the mid-April to May range at 16.54. This is calculated as the 0.618 Fibonacci ratio of the range's height extrapolated lower. 

Further bearishness could still see USD/MXN reach 16.34, the more bearish target, calculated by taking the full height of the range and extrapolating it lower. 

The Relative Strength Index (RSI) momentum indicator is still oversold, which indicates traders should not add to their short positions. If the RSI exits oversold conditions and returns to neutral territory above 30, it would be a signal to close existing short positions as a correction is probably underway. Once the correction ends, however, the descending channel is expected to continue taking prices lower in line with the dominant downtrend. 

Given the medium and long-term trends are also bearish, the odds further favor more downside. 

Economic Indicator

Retail Sales (MoM)

The Retail Sales released by INEGI measures the total receipts of retail stores. Monthly percent changues reflect the rate of changes of such sales. Changes in retail sales are widely followed as an indicator of consumer spending. Generally speaking, a high reading is seen as positive or bullish for the Mexican peso, while a low reading is seen as negative or bearish.

Read more.

Last release: Mon May 20, 2024 12:00

Frequency: Monthly

Actual: -0.2%

Consensus: -

Previous: 0.4%

Source:


Disclaimer: For information purposes only. Past performance is not indicative of future results.
placeholder
Ethereum Price Slips Lower — $3,000 Looms as the Key BattlegroundEthereum is attempting to recover from a $3,026 low but remains below $3,200 and the 100-hour SMA, with a bearish trend line near $3,175 capping rebounds as bulls need a clean break above $3,200 to target $3,250–$3,400, while a drop below $3,050 risks a retest of $3,000 and $2,940.
Author  Mitrade
Dec 15, Mon
Ethereum is attempting to recover from a $3,026 low but remains below $3,200 and the 100-hour SMA, with a bearish trend line near $3,175 capping rebounds as bulls need a clean break above $3,200 to target $3,250–$3,400, while a drop below $3,050 risks a retest of $3,000 and $2,940.
placeholder
Bitcoin Slides 5% as Sellers Lean In — Can BTC Reclaim $88,000?Bitcoin has dropped back below $88,000 after rolling over from $90,500, with price still trading under the 100-hour Simple Moving Average. The sell-off found a floor at $85,151, and BTC is now consolidating near that base, but rebounds are facing pressure from a bearish trend line around $89,000. Bulls need to retake $88,000–$89,000 to ease downside risk; failure to do so keeps $85,500–$85,000 and then $83,500 in play, with $80,000 as the deeper “line in the sand.” Bitcoin (BTC) is back in damage-control mode after a sharp pullback wiped out recent gains. The price failed to reclaim the $90,000–$90,500 band, rolled over, and slid through $88,500 before briefly dipping under $87,000. Buyers did show up around $85,000, but the rebound so far looks more like stabilization than a clear trend reversal. Bitcoin dips hard, finds a bid near $85,000(h3) BTC’s latest move lower began when it couldn’t build follow-through above $90,000 and $90,500. Once that upside stalled, sellers took control and pushed price down through $88,500. The slide accelerated enough to spike below $87,000, but the market didn’t free-fall. Bulls defended the $85,000 zone, printing a low at $85,151. Since then, Bitcoin has been consolidating below the 23.6% Fibonacci retracement of the drop from the $93,560 swing high to the $85,151 low — a clue that the bounce is still shallow and that sellers haven’t fully backed off yet. Structurally, BTC is still on the back foot: It’s trading below $88,000, and It remains below the 100-hour Simple Moving Average, keeping short-term trend pressure pointed downward. Resistance is layered, and $89,000 is the problem area(h3) If bulls try to turn this into a recovery, they’ll have to climb through multiple ceilings in quick succession. First, BTC faces resistance around $87,150, followed by a more meaningful barrier near $87,500. From there, the market’s attention snaps back to $88,000 — the level BTC just lost and now needs to reclaim. A close back above $88,000 would improve the tone, but it doesn’t solve the bigger issue: there’s a bearish trend line on the hourly BTC/USD chart (Kraken feed) with resistance near $89,000, which also lines up with the next technical hurdle. If BTC can push through $89,000 and hold, the rebound could extend toward $90,000, with follow-through targets at $91,000 and $91,500. But until price clears that $88,000–$89,000 zone, rallies are at risk of being sold rather than chased. If BTC fails to reclaim resistance, the downside path is clear(h3) The near-term bear case is simple: if Bitcoin can’t climb back above the $87,000 area and keep traction, sellers may attempt another leg lower. Support levels line up like this: Immediate support: $85,500 First major support: $85,000 Next support: $83,500 Then $82,500 in the near term Below that, the major “don’t break this” level is still $80,000. If BTC slips under $80,000, the risk of acceleration to the downside increases significantly — not because it’s magic, but because it’s the kind of psychological and structural level that tends to trigger forced de-risking. Indicators: momentum still leans bearish(h3) The intraday indicators aren’t offering much comfort yet: Hourly MACD is losing pace in the bearish zone. Hourly RSI remains below 50, suggesting sellers still have the upper hand on short timeframes. So while the $85,000 defense held for now, the market hasn’t flipped bullish — it’s just stopped bleeding.
Author  Mitrade
Dec 16, Tue
Bitcoin has dropped back below $88,000 after rolling over from $90,500, with price still trading under the 100-hour Simple Moving Average. The sell-off found a floor at $85,151, and BTC is now consolidating near that base, but rebounds are facing pressure from a bearish trend line around $89,000. Bulls need to retake $88,000–$89,000 to ease downside risk; failure to do so keeps $85,500–$85,000 and then $83,500 in play, with $80,000 as the deeper “line in the sand.” Bitcoin (BTC) is back in damage-control mode after a sharp pullback wiped out recent gains. The price failed to reclaim the $90,000–$90,500 band, rolled over, and slid through $88,500 before briefly dipping under $87,000. Buyers did show up around $85,000, but the rebound so far looks more like stabilization than a clear trend reversal. Bitcoin dips hard, finds a bid near $85,000(h3) BTC’s latest move lower began when it couldn’t build follow-through above $90,000 and $90,500. Once that upside stalled, sellers took control and pushed price down through $88,500. The slide accelerated enough to spike below $87,000, but the market didn’t free-fall. Bulls defended the $85,000 zone, printing a low at $85,151. Since then, Bitcoin has been consolidating below the 23.6% Fibonacci retracement of the drop from the $93,560 swing high to the $85,151 low — a clue that the bounce is still shallow and that sellers haven’t fully backed off yet. Structurally, BTC is still on the back foot: It’s trading below $88,000, and It remains below the 100-hour Simple Moving Average, keeping short-term trend pressure pointed downward. Resistance is layered, and $89,000 is the problem area(h3) If bulls try to turn this into a recovery, they’ll have to climb through multiple ceilings in quick succession. First, BTC faces resistance around $87,150, followed by a more meaningful barrier near $87,500. From there, the market’s attention snaps back to $88,000 — the level BTC just lost and now needs to reclaim. A close back above $88,000 would improve the tone, but it doesn’t solve the bigger issue: there’s a bearish trend line on the hourly BTC/USD chart (Kraken feed) with resistance near $89,000, which also lines up with the next technical hurdle. If BTC can push through $89,000 and hold, the rebound could extend toward $90,000, with follow-through targets at $91,000 and $91,500. But until price clears that $88,000–$89,000 zone, rallies are at risk of being sold rather than chased. If BTC fails to reclaim resistance, the downside path is clear(h3) The near-term bear case is simple: if Bitcoin can’t climb back above the $87,000 area and keep traction, sellers may attempt another leg lower. Support levels line up like this: Immediate support: $85,500 First major support: $85,000 Next support: $83,500 Then $82,500 in the near term Below that, the major “don’t break this” level is still $80,000. If BTC slips under $80,000, the risk of acceleration to the downside increases significantly — not because it’s magic, but because it’s the kind of psychological and structural level that tends to trigger forced de-risking. Indicators: momentum still leans bearish(h3) The intraday indicators aren’t offering much comfort yet: Hourly MACD is losing pace in the bearish zone. Hourly RSI remains below 50, suggesting sellers still have the upper hand on short timeframes. So while the $85,000 defense held for now, the market hasn’t flipped bullish — it’s just stopped bleeding.
placeholder
December Santa Claus Rally: New highs in sight for US and European stocks?Historical data show a rising trend of US and European stocks in December. If the momentum is strong, fund managers may rush in with a buying frenzy.
Author  Mitrade
Yesterday 02: 50
Historical data show a rising trend of US and European stocks in December. If the momentum is strong, fund managers may rush in with a buying frenzy.
placeholder
XRP’s Price Action Flashes a Warning Even as ETF Flows Stay PositiveXRP’s structure remains weak despite 18 straight positive closes in spot XRP ETFs, with analysts warning that $1.98 and other nearby resistance zones could cap rebounds unless the YO region is reclaimed, while deeper downside scenarios keep $1.53 on watch as a potential (not guaranteed) accumulation area.
Author  Mitrade
Yesterday 06: 37
XRP’s structure remains weak despite 18 straight positive closes in spot XRP ETFs, with analysts warning that $1.98 and other nearby resistance zones could cap rebounds unless the YO region is reclaimed, while deeper downside scenarios keep $1.53 on watch as a potential (not guaranteed) accumulation area.
placeholder
Gold declines on profit-taking, USD strength ahead of US CPI releaseGold price (XAU/USD) edges lower below $4,350 during the Asian trading hours on Thursday. The precious metal retreats from seven-week highs amid some profit-taking and a rebound in the US Dollar (USD).
Author  FXStreet
7 hours ago
Gold price (XAU/USD) edges lower below $4,350 during the Asian trading hours on Thursday. The precious metal retreats from seven-week highs amid some profit-taking and a rebound in the US Dollar (USD).
goTop
quote