AUD/USD on the backfoot, slides below 0.6700

Source Fxstreet
  • Australian Dollar drops 0.37% against the US Dollar, trading at 0.6668.
  • US Treasury yields rise, overshadowing upbeat market sentiment and pressuring AUD.
  • Focus shifts to RBA meeting minutes and upcoming Fed speakers and minutes release.

The Australian Dollar registered losses of 0.37% against the US Dollar on Monday, amid rising US Treasury yields that underpinned the Greenback. An upbeat market sentiment could not boost the high-beta Aussie Dollar, which tumbled below the 0.6700 figure. As the Tuesday Asian session begins, the AUD/USD trades at 0.6668, virtually unchanged.

AUD/USD dips below 0.6700 as high US Treasury yields bolster the Greenback

Data-wise, the US economy was empty, though several Fed officials crossed the wires. Following April's data, vice-Chair Philip Jefferson stated that it is too early to tell if the inflation slowdown will last. Michael Barr, the Vice-Chair of Supervision, said that restrictive policy needs more time to do its work, while Atlanta’s Fed President Raphael Bostic stated he expects rates to remain steady.

In the meantime, the Australian docket would feature the release of the minutes of the Reserve Bank of Australia (RBA) monetary policy meeting. ANZ analysts wrote, “We suspect the decision to keep rates on hold was not a close one, given the tone of the post-meeting statement.”

On the US front, Tuesday’s economic docket will feature additional Fed speakers ahead of the release of the last meeting minutes on Wednesday.

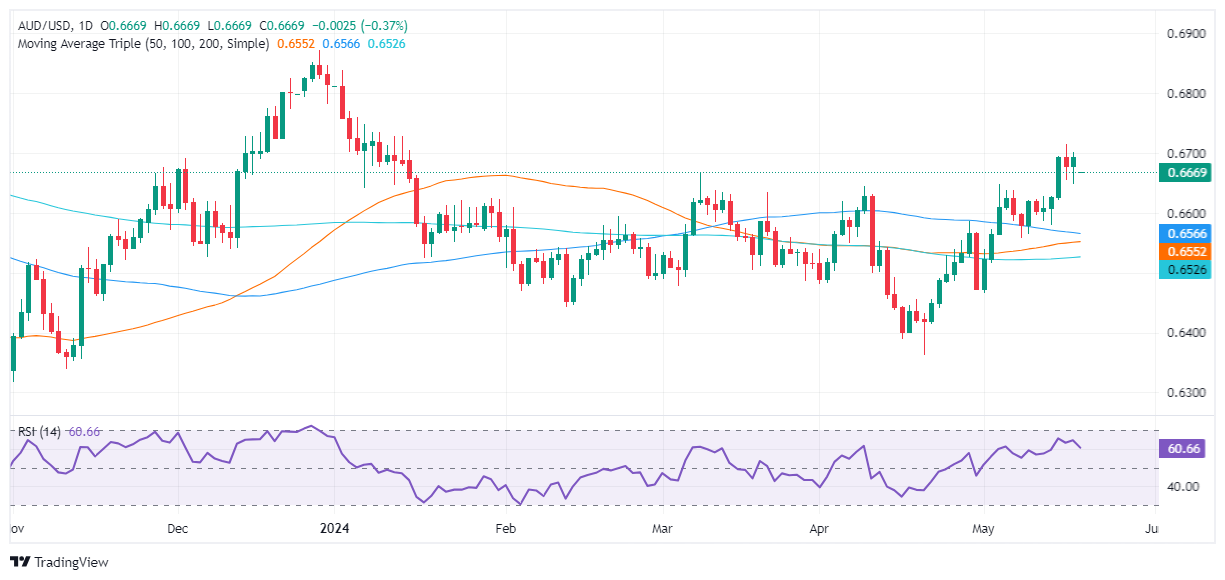
AUD/USD Price Analysis: Technical outlook

The AUD/USD is neutral to upward bias, but the dip below the March 8 high of 0.6667 could pave the way for a deeper pullback. The next support would be the 0.6600 mark, followed by the 100-day moving average (DMA) at 0.6564 and the 50-DMA at 0.6552. Once surpassed, the next stop would be the 200-DMA at 0.6525.

AUD/USD

Overview
Today last price 0.6669
Today Daily Change -0.0024
Today Daily Change % -0.36
Today daily open 0.6693
 
Trends
Daily SMA20 0.6577
Daily SMA50 0.6551
Daily SMA100 0.6567
Daily SMA200 0.6525
 
Levels
Previous Daily High 0.6701
Previous Daily Low 0.6649
Previous Weekly High 0.6714
Previous Weekly Low 0.658
Previous Monthly High 0.6644
Previous Monthly Low 0.6362
Daily Fibonacci 38.2% 0.6681
Daily Fibonacci 61.8% 0.6669
Daily Pivot Point S1 0.6661
Daily Pivot Point S2 0.6629
Daily Pivot Point S3 0.6609
Daily Pivot Point R1 0.6713
Daily Pivot Point R2 0.6733
Daily Pivot Point R3 0.6766


Disclaimer: For information purposes only. Past performance is not indicative of future results.
placeholder
A Crash After a Surge: Why Silver Lost 40% in a Week?TradingKey - Spot Silver ( XAGUSD) prices have continued to decline; on Thursday, silver plummeted as much as 20% to break below $71 per ounce, and on Friday the sell-off intensified as prices fell fu
Author  TradingKey
10 hours ago
TradingKey - Spot Silver ( XAGUSD) prices have continued to decline; on Thursday, silver plummeted as much as 20% to break below $71 per ounce, and on Friday the sell-off intensified as prices fell fu
placeholder
Bitcoin is trading around $63,000, down nearly 40% from its peak near $126,000Wall Street desks are no longer talking about upside dreams. The talk right now is how far Bitcoin charts could fall if selling keeps piling up. According to data from TradingView, Bitcoin’s price now sits at a shocking $63,500, after falling from $70,000 just this morning, losing $13,000 in 6 days, and staying far below […]
Author  Cryptopolitan
11 hours ago
Wall Street desks are no longer talking about upside dreams. The talk right now is how far Bitcoin charts could fall if selling keeps piling up. According to data from TradingView, Bitcoin’s price now sits at a shocking $63,500, after falling from $70,000 just this morning, losing $13,000 in 6 days, and staying far below […]
placeholder
WTI declines below $63.00 as US-Iran talks loom West Texas Intermediate (WTI), the US crude oil benchmark, is trading around $62.85 during the Asian trading hours on Friday. The WTI price declines after the United States (US) and Iran agreed to hold talks in Oman on Friday. 
Author  FXStreet
17 hours ago
West Texas Intermediate (WTI), the US crude oil benchmark, is trading around $62.85 during the Asian trading hours on Friday. The WTI price declines after the United States (US) and Iran agreed to hold talks in Oman on Friday. 
placeholder
Bitcoin Surrenders $65,000 as Analysts Warn of ‘Structural’ Market BreakBitcoin plunges 11% to break $65k as analysts term the crash "structural," citing a $1 trillion market wipeout and $2.09 billion in daily liquidations.
Author  Mitrade
19 hours ago
Bitcoin plunges 11% to break $65k as analysts term the crash "structural," citing a $1 trillion market wipeout and $2.09 billion in daily liquidations.
placeholder
Bitcoin Drops to $70,000. U.S. Government Refuses to Bail Out Market, End of Bull Market or Golden Pit? The U.S. government refuses to bail out Bitcoin, and with Fed rate cuts nowhere in sight, a continued downward trend to test for a bottom is likely after a brief rebound.During the mid-da
Author  TradingKey
Yesterday 10: 33
The U.S. government refuses to bail out Bitcoin, and with Fed rate cuts nowhere in sight, a continued downward trend to test for a bottom is likely after a brief rebound.During the mid-da
Related Instrument
goTop
quote