GBP/USD Price Analysis: Pushes above 1.2700 as bulls remain in charge

Source Fxstreet
  • GBP/USD extends its gains to two straight days, climbing above 1.2700.
  • Despite remaining bullish, bears loom as daily close below 1.2700 could reignite selling pressure.
  • Buyers are in charge, and need the GBP/USD staying above 1.2700, to challenge 1.2800 near term.

The Pound Sterling begins the week solidly against the US Dollar, registering modest gains of 0.04% after hitting a daily low of 1.2681. At the time of writing, the GBP/USD trades at 1.2703.

GBP/USD Price Analysis: Technical outlook

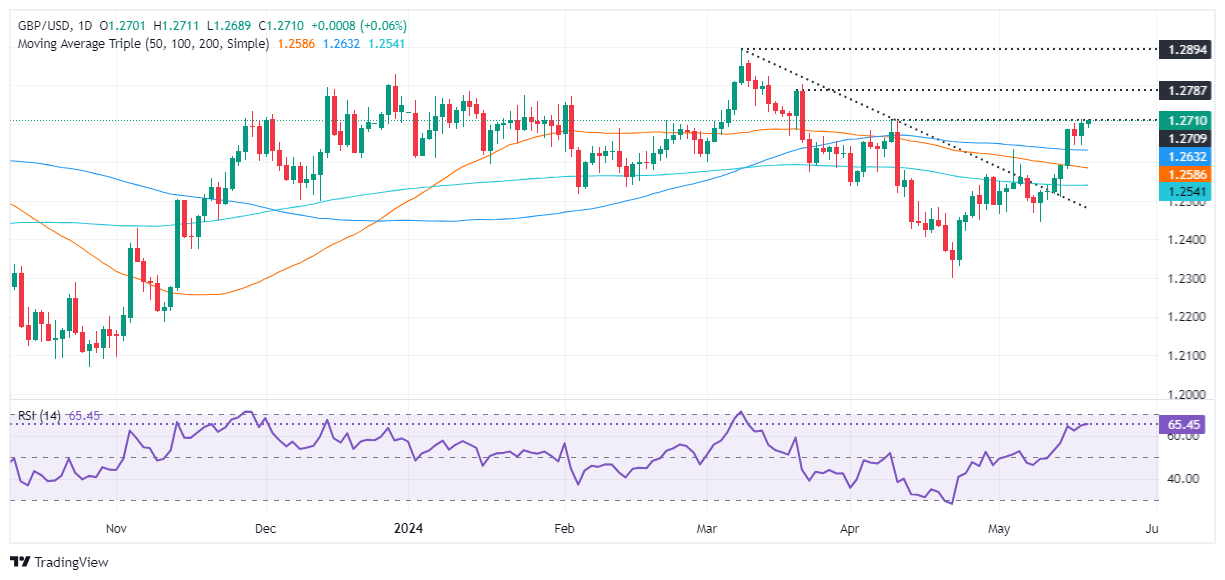
Last week, the GBP/USD edged toward the current exchange rate, clearing stir resistance levels like the 50 and 100-day moving averages (DMAs), which opened the door for further gains. Although momentum backs buyers, as depicted by the Relative Strength Index (RSI), downside risks remain.

For a bullish continuation, the GBP/USD must remain above 1.2700. In that event, the first resistance would be the March 21 cycle high at 1.2803. Once surpassed, sellers’ next line of defense would be the year-to-date (YTD) high at 1.2893, ahead of 1.2900, followed by the psychological 1.3000 mark.

Conversely, if sellers drag the GBP/USD spot price below 1.2700, that could exacerbate a retest of the confluence of the 100-DMA and the May 3 high at 1.2634. Further losses lie below the latter, which would expose 1.2594 and the 50-DMA at 1.2584 before dipping to the 200-DMA at 1.2539.

GBP/USD Price Action – Daily Chart

GBP/USD

Overview
Today last price 1.2708
Today Daily Change 0.0007
Today Daily Change % 0.06
Today daily open 1.2701
 
Trends
Daily SMA20 1.2538
Daily SMA50 1.2588
Daily SMA100 1.2632
Daily SMA200 1.2541
 
Levels
Previous Daily High 1.2712
Previous Daily Low 1.2645
Previous Weekly High 1.2712
Previous Weekly Low 1.2509
Previous Monthly High 1.2709
Previous Monthly Low 1.23
Daily Fibonacci 38.2% 1.2686
Daily Fibonacci 61.8% 1.2671
Daily Pivot Point S1 1.266
Daily Pivot Point S2 1.2619
Daily Pivot Point S3 1.2593
Daily Pivot Point R1 1.2727
Daily Pivot Point R2 1.2753
Daily Pivot Point R3 1.2794


British Pound PRICE Today

The table below shows the percentage change of British Pound (GBP) against listed major currencies today. British Pound was the strongest against the New Zealand Dollar.

  USD EUR GBP JPY CAD AUD NZD CHF
USD   0.00% -0.06% 0.33% -0.10% 0.22% 0.31% -0.07%
EUR -0.01%   -0.10% 0.36% -0.10% 0.25% 0.30% -0.07%
GBP 0.06% 0.10%   0.32% 0.00% 0.34% 0.39% 0.02%
JPY -0.33% -0.36% -0.32%   -0.45% -0.10% -0.01% -0.39%
CAD 0.10% 0.10% 0.00% 0.45%   0.28% 0.41% 0.03%
AUD -0.22% -0.25% -0.34% 0.10% -0.28%   0.05% -0.32%
NZD -0.31% -0.30% -0.39% 0.00% -0.41% -0.05%   -0.38%
CHF 0.07% 0.07% -0.02% 0.39% -0.03% 0.32% 0.38%  

The heat map shows percentage changes of major currencies against each other. The base currency is picked from the left column, while the quote currency is picked from the top row. For example, if you pick the British Pound from the left column and move along the horizontal line to the US Dollar, the percentage change displayed in the box will represent GBP (base)/USD (quote).


Disclaimer: For information purposes only. Past performance is not indicative of future results.
placeholder
Markets in 2026: Will gold, Bitcoin, and the U.S. dollar make history again? — These are how leading institutions thinkAfter a turbulent 2025, what lies ahead for commodities, forex, and cryptocurrency markets in 2026?
Author  Insights
Dec 25, 2025
After a turbulent 2025, what lies ahead for commodities, forex, and cryptocurrency markets in 2026?
placeholder
ECB Policy Outlook for 2026: What It Could Mean for the Euro’s Next MoveWith the ECB likely holding rates steady at 2.15% and the Fed potentially extending cuts into 2026, EUR/USD may test 1.20 if Eurozone growth proves resilient, but weaker growth and an ECB pivot could pull the pair back toward 1.13 and potentially 1.10.
Author  Mitrade
Dec 26, 2025
With the ECB likely holding rates steady at 2.15% and the Fed potentially extending cuts into 2026, EUR/USD may test 1.20 if Eurozone growth proves resilient, but weaker growth and an ECB pivot could pull the pair back toward 1.13 and potentially 1.10.
placeholder
My Top 5 Stock Market Predictions for 2026Five 2026 market predictions written in a native, news-style voice: AI’s winners and losers, broader sector leadership, dividend demand, valuation cooling as the Shiller CAPE sits at 39 (Dec. 31, 2025), and quantum-computing bursts—while keeping all original facts and numbers unchanged.
Author  Mitrade
Jan 06, Tue
Five 2026 market predictions written in a native, news-style voice: AI’s winners and losers, broader sector leadership, dividend demand, valuation cooling as the Shiller CAPE sits at 39 (Dec. 31, 2025), and quantum-computing bursts—while keeping all original facts and numbers unchanged.
placeholder
Financial Markets 2026: Volatility Catalysts in Gold, Silver, Oil, and Blue-Chip Stocks—A CFD Trader's OutlookGet a comprehensive financial market 2026 outlook exploring key economic drivers, volatility catalysts in gold, oil and stocks, and what the evolving economic outlook means for cfd trading strategies and risk management on global markets.
Author  Rachel Weiss
May 15, Fri
Get a comprehensive financial market 2026 outlook exploring key economic drivers, volatility catalysts in gold, oil and stocks, and what the evolving economic outlook means for cfd trading strategies and risk management on global markets.
placeholder
Euro softens to near 1.1600 on US–Iran tensions The EUR/USD pair trades in negative territory around 1.1615 during the early Asian session on Monday. The Euro (EUR) extends the decline as the prolonged US-Iran conflict weighs on the riskier assets.
Author  FXStreet
4 hours ago
The EUR/USD pair trades in negative territory around 1.1615 during the early Asian session on Monday. The Euro (EUR) extends the decline as the prolonged US-Iran conflict weighs on the riskier assets.
Related Instrument
goTop
quote