EUR/GBP Price Analysis: Finds support from two major Moving Averages

Source Fxstreet
  • EUR/GBP has declined to support from a cluster of Moving Averages. 
  • The pair has reached a pivotal level within a range that has been unfolding since January.
  • In the absence of any bullish signs it could continue falling to the range floor as the sideways trend extends. 

EUR/GBP has continued falling within a multi-month range that began in January 2024. 

The pair has declined to support from two major moving averages – the 50 and 100-day Simple Moving Averages (SMA) – situated at 0.8566-67. 

EUR/GBP Daily Chart 

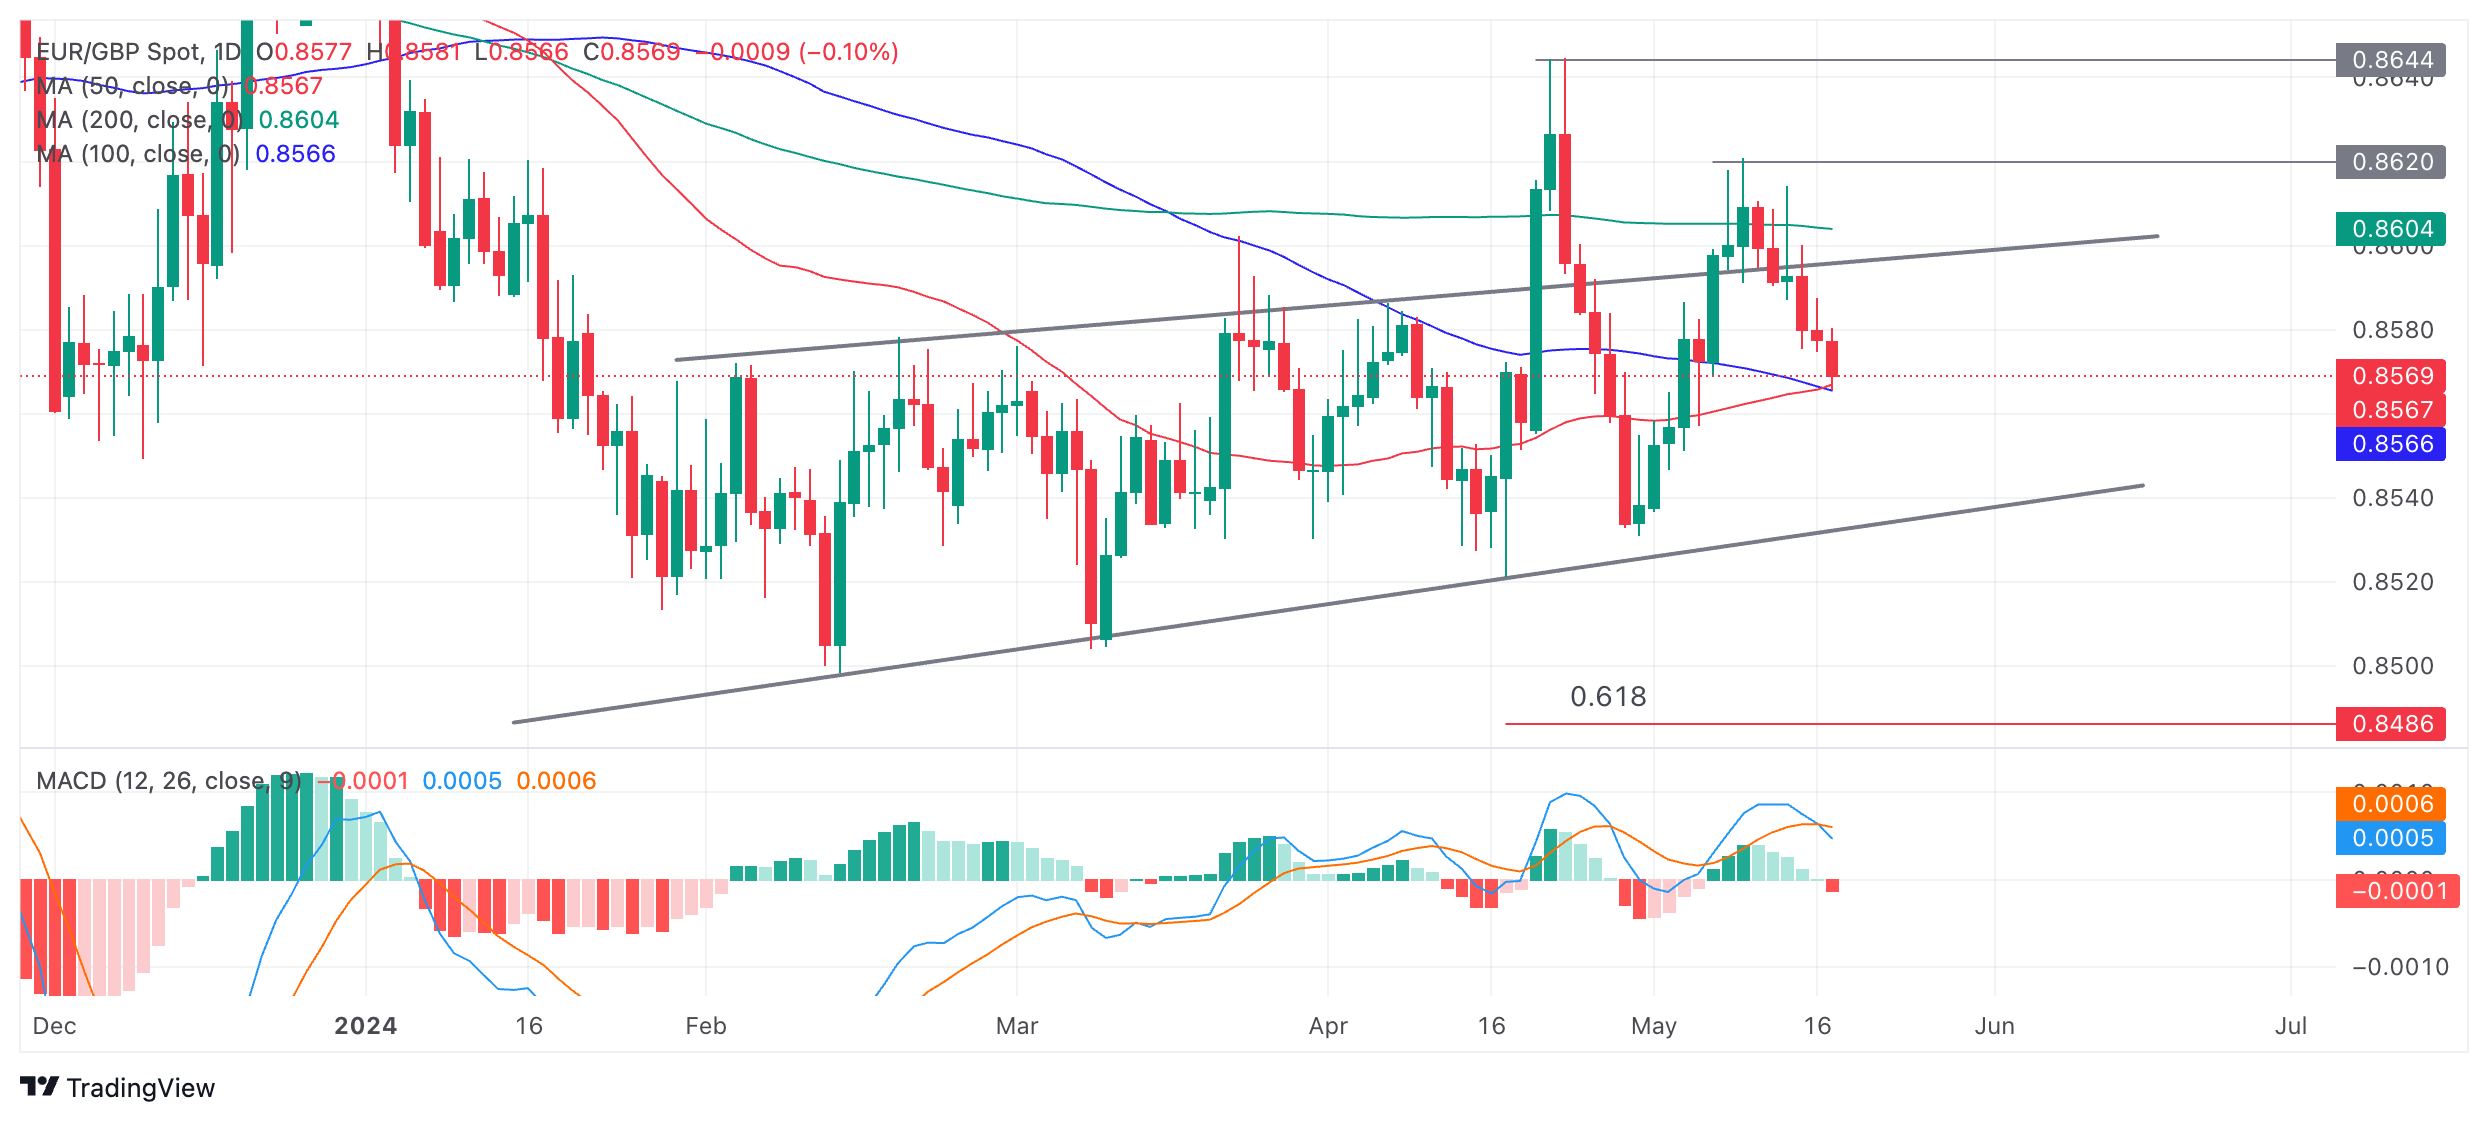
The Moving Average Convergence Divergence (MACD) indicator has crossed below its red signal line, providing further bearish evidence suggesting EUR/GBP could continue descending within its range/channel.  

Given the bearish tone of the charts, EUR/GBP could now break below the support from the SMAs and continue falling to the range low at circa 0.8540. 

There is also a possibility, however, that EUR/GBP could recover from support at the SMAs. If so, it could start rising to the ceiling of the range at 0.8600. At the moment, however, there is no indication from price action that such a bullish short-term reversal is underway. 


Disclaimer: For information purposes only. Past performance is not indicative of future results.
placeholder
ECB Policy Outlook for 2026: What It Could Mean for the Euro’s Next MoveWith the ECB likely holding rates steady at 2.15% and the Fed potentially extending cuts into 2026, EUR/USD may test 1.20 if Eurozone growth proves resilient, but weaker growth and an ECB pivot could pull the pair back toward 1.13 and potentially 1.10.
Author  Mitrade
Dec 26, 2025
With the ECB likely holding rates steady at 2.15% and the Fed potentially extending cuts into 2026, EUR/USD may test 1.20 if Eurozone growth proves resilient, but weaker growth and an ECB pivot could pull the pair back toward 1.13 and potentially 1.10.
placeholder
Gold Price Forecast: XAU/USD climbs to near $4,350 on Fed rate cut bets, geopolitical risks Gold price (XAU/USD) rises to near $4,345 during the early Asian session on Friday. Gold finished 2025 with a significant rally, achieving an annual gain of around 65%, its biggest annual gain since 1979.
Author  FXStreet
Jan 02, Fri
Gold price (XAU/USD) rises to near $4,345 during the early Asian session on Friday. Gold finished 2025 with a significant rally, achieving an annual gain of around 65%, its biggest annual gain since 1979.
placeholder
Gold slumps below $4,800 on renewed Strait of Hormuz tensions Gold price (XAU/USD) slumps to around $4,775 during the early Asian session on Monday. Traders digest renewed tensions between the United States (US) and Iran over the critical Strait of Hormuz.
Author  FXStreet
Apr 20, Mon
Gold price (XAU/USD) slumps to around $4,775 during the early Asian session on Monday. Traders digest renewed tensions between the United States (US) and Iran over the critical Strait of Hormuz.
placeholder
U.S.-Iran Standoff Suddenly Escalates Over Weekend, Crude Jumps 8% at Monday OpenOver the weekend, the U.S. and Iran engaged in a new round of maneuvering over the situation in the Middle East, leading to a rapid escalation in geopolitical risks. As a result, internat
Author  TradingKey
Apr 20, Mon
Over the weekend, the U.S. and Iran engaged in a new round of maneuvering over the situation in the Middle East, leading to a rapid escalation in geopolitical risks. As a result, internat
placeholder
Gold holds steady above $4,800 amid US-Iran ceasefire uncertainty Gold price (XAU/USD) trades on a flat note near $4,825 during the early Asian session on Tuesday. The precious metal steadies amid renewed geopolitical instability in the Middle East.  
Author  FXStreet
23 hours ago
Gold price (XAU/USD) trades on a flat note near $4,825 during the early Asian session on Tuesday. The precious metal steadies amid renewed geopolitical instability in the Middle East.  
Related Instrument
goTop
quote