

AUD/USD falls amid highs US yields, Fed’s tough stance
- Australian Dollar trades at 0.6678, down 0.23%, influenced by higher US yields.
- Jobless claims rise, housing data fluctuates, and industrial production stalls.
- Fed officials suggest higher rates may persist as Australian jobs report shows mixed results with unemployment revised to 4.1%.
The Australian Dollar posted losses of 0.23% against the US Dollar on Thursday amid higher US yields that underpinned the Greenback during the day. Wall Street hit new all-time highs but retreated afterward, ending the session with losses. As Friday’s Asian session begins, the AUD/USD trades at 0.6678, virtually unchanged.
AUD/USD down as US yields rise and traders speculate on potential Federal Reserve policy easing
Traders’ sentiment remains upbeat, as speculations that the Federal Reserve would join the list of central banks that might ease policy grew. The latest US consumer inflation report on Wednesday increased the odds that the Fed might cut at least 41 basis points toward the end of 2024.
On Thursday, Initial Jobless Claims for the last week increased by 222K, above estimates, but trailed the prior week’s 232K. Other data showed that housing data was mixed, with Housing Starts increasing 5.7% YoY, while Building Permits plunged -3%.
Elsewhere, the Fed revealed that Industrial Production stalled in April, coming to 0% MoM, below estimates and the prior month’s 0.1% increase.
Meanwhile, a slew of Fed officials hit the wires on Thursday, saying the central bank should keep rates higher for longer as they wait for more evidence that inflation is slowing. The Fed Regional Bank Presidents Loretta Mester, John Williams, and Thomas Barkin argued that curb inflation to their 2% goal may take longer than expected.
On the Aussies' front, the latest jobs report revealed the economy added 38.5K jobs in April, but the unemployment rate was revised from 3.9% to 4.1%. Most of the jobs added were part-time, with figures rising 44.6K, offsetting the losses of full-time employment of -6.1 K.
ANZ analysts said, “The weakness in hours worked and the moderation in yearly wage growth reported in the Wage Price Index together confirm a picture of a softening labour market. There is no change to our RBA view off the back of these data.”
Ahead of the week, the Australian docket is empty, while the US one will feature further Fed speaking, led by Governor Christopher Waller.
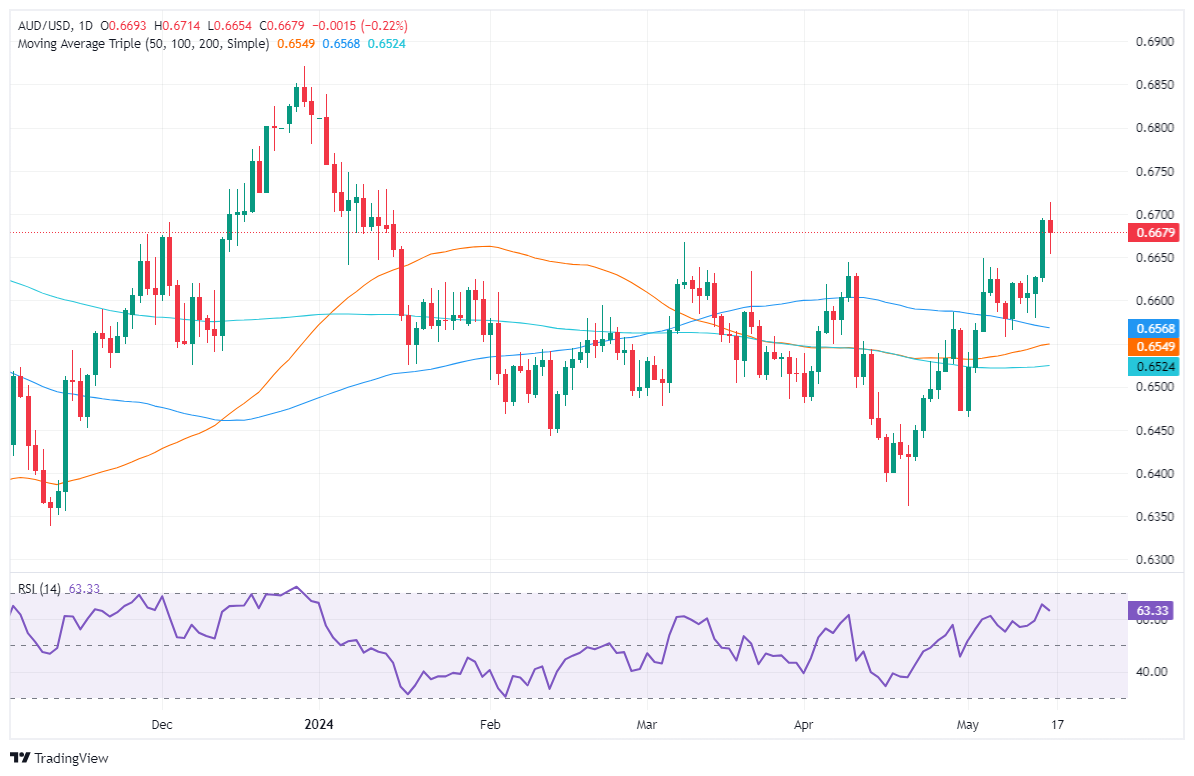
AUD/USD Price Analysis: Technical outlook
The AUD/USD uptrend remains in place, though it paused after breaching the 0.6700 figure. Although momentum is on the bulls’ side, as depicted by the Relative Strength Index (RSI), a drop below the Thursday low of 0.6654 could exacerbate a drop toward the May 14 low of 0.6579. On the other hand, if buyers regain 0.6700, that could pave the way to test the current week's high of 0.6714, ahead of challenging 0.6750.
Australian Dollar PRICE This week
The table below shows the percentage change of Australian Dollar (AUD) against listed major currencies this week. Australian Dollar was the strongest against the US Dollar.
| USD | EUR | GBP | JPY | CAD | AUD | NZD | CHF | |
|---|---|---|---|---|---|---|---|---|
| USD | -0.87% | -1.14% | -0.22% | -0.39% | -1.13% | -1.58% | -0.04% | |
| EUR | 0.87% | -0.32% | 0.64% | 0.46% | -0.29% | -0.73% | 0.83% | |
| GBP | 1.14% | 0.32% | 0.91% | 0.79% | 0.03% | -0.41% | 1.16% | |
| JPY | 0.22% | -0.64% | -0.91% | -0.20% | -0.89% | -1.43% | 0.23% | |
| CAD | 0.39% | -0.46% | -0.79% | 0.20% | -0.72% | -1.21% | 0.28% | |
| AUD | 1.13% | 0.29% | -0.03% | 0.89% | 0.72% | -0.54% | 1.13% | |
| NZD | 1.58% | 0.73% | 0.41% | 1.43% | 1.21% | 0.54% | 1.57% | |
| CHF | 0.04% | -0.83% | -1.16% | -0.23% | -0.28% | -1.13% | -1.57% |
The heat map shows percentage changes of major currencies against each other. The base currency is picked from the left column, while the quote currency is picked from the top row. For example, if you pick the Australian Dollar from the left column and move along the horizontal line to the US Dollar, the percentage change displayed in the box will represent AUD (base)/USD (quote).
Recommended Articles


