USD/SEK declines as markets digest US Retail Sales and CPI figures

Source Fxstreet
  • US CPI and Retail Sales came in lower than expected.
  • The odds of a cut from the Fed in July slightly increase, and September continues being the best-case scenario.
  • Fed officials might change their tone as economic figures showed softness.

On Wednesday, the USD/SEK saw sharp losses as the potential for sooner interest rate cuts by the Fed, in light of the recent Consumer Price Index (CPI) disinflation and lackluster Retail Sales, may exert weight on the USD.

On the data front, the US Bureau of Labor Statistics reported that the US witnessed a marginal decrease in inflation, with the headline CPI moving down from 3.5% in March to 3.4% in April. Core CPI also observed a fall, retreating from 3.8% to 3.6%, aligning with market expectations. In addition, U.S. Retail sales in April remained stagnant, a dip from the anticipated 0.4% growth.

The cooling economic indicators imply that the Federal Reserve might contemplate a sooner start of the easing cycle which would invariably exert pressure on the USD. The CME FedWatch Tool highlights that investors have already priced in that there will be no changes in interest rates in June, but continue seeing with good eyes a cut in September. Those odds slightly increase for the July meeting but remain low.

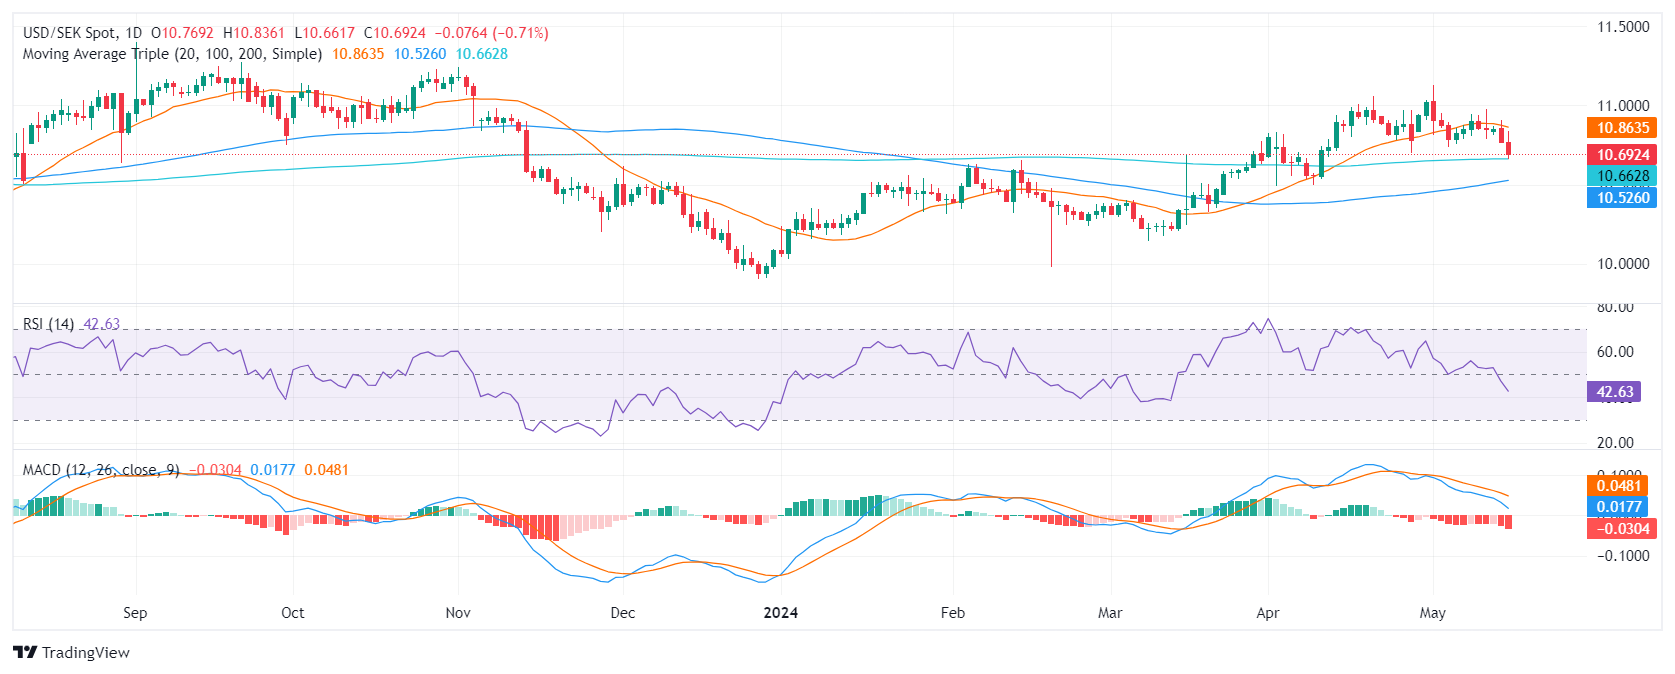
USD/SEK technical analysis

On the daily chart, the Relative Strength Index (RSI) for the USD/SEK pair resides in negative territory. The latest reading, marking a downward trend, suggests that sellers are dominating. Moreover, the Moving Average Convergence Divergence (MACD) is producing rising red bars, thus demonstrating negative momentum.

That being said, strong support was noted at the 200-day Simple Moving Average (SMA) with buyers defending the level at 10.66. This defense acts as a crucial bulwark against any potential downward trend reversals.


EUR/JPY

Overview
Today last price 168.37
Today Daily Change -0.87
Today Daily Change % -0.51
Today daily open 169.24
 
Trends
Daily SMA20 166.55
Daily SMA50 164.62
Daily SMA100 162.45
Daily SMA200 160.61
 
Levels
Previous Daily High 169.36
Previous Daily Low 168.47
Previous Weekly High 167.97
Previous Weekly Low 164.48
Previous Monthly High 171.6
Previous Monthly Low 162.28
Daily Fibonacci 38.2% 169.02
Daily Fibonacci 61.8% 168.81
Daily Pivot Point S1 168.69
Daily Pivot Point S2 168.14
Daily Pivot Point S3 167.8
Daily Pivot Point R1 169.58
Daily Pivot Point R2 169.91
Daily Pivot Point R3 170.46


Disclaimer: For information purposes only. Past performance is not indicative of future results.
placeholder
Bitcoin Suffers Year’s Strongest Waterfall-Style Decline. Will It Next Drop to the $60,000 Mark?During the Asian trading session on June 4, Bitcoin continued its multi-day slump, briefly dropping below the $62,000 mark to $61,338. As of press time, Bitcoin was trading at $63,844, wi
Author  TradingKey
13 hours ago
During the Asian trading session on June 4, Bitcoin continued its multi-day slump, briefly dropping below the $62,000 mark to $61,338. As of press time, Bitcoin was trading at $63,844, wi
placeholder
Bitcoin drops below $65K amid reinforced bear market signalsBitcoin (BTC) dipped further below $65,000 on Wednesday, with onchain data from Glassnode signaling a market firmly in a bear phase. The decline has pushed prices back into a key valuation range between the Realized Price and the True Market Mean.
Author  FXStreet
22 hours ago
Bitcoin (BTC) dipped further below $65,000 on Wednesday, with onchain data from Glassnode signaling a market firmly in a bear phase. The decline has pushed prices back into a key valuation range between the Realized Price and the True Market Mean.
placeholder
Forex Today: US Dollar stays resilient ahead of key US dataHere is what you need to know on Wednesday, June 3:
Author  FXStreet
Yesterday 10: 27
Here is what you need to know on Wednesday, June 3:
placeholder
$1.5 Billion in Crypto Assets Liquidated, Bitcoin Falls Below $66,000 Mark. What Is the Reason?On June 2, Eastern Time, the cryptocurrency market suffered its most severe wave of concentrated liquidations so far this year. Bitcoin ( BTC) fell below the $70,000 psychological support
Author  TradingKey
Yesterday 06: 32
On June 2, Eastern Time, the cryptocurrency market suffered its most severe wave of concentrated liquidations so far this year. Bitcoin ( BTC) fell below the $70,000 psychological support
placeholder
WTI rises to near $93.00 as Iran launches missiles toward Kuwait, BahrainWest Texas Intermediate (WTI) gains ground for the third successive day, trading around $92.90 per barrel during the Asian hours on Wednesday.
Author  FXStreet
Yesterday 01: 24
West Texas Intermediate (WTI) gains ground for the third successive day, trading around $92.90 per barrel during the Asian hours on Wednesday.
Related Instrument
goTop
quote